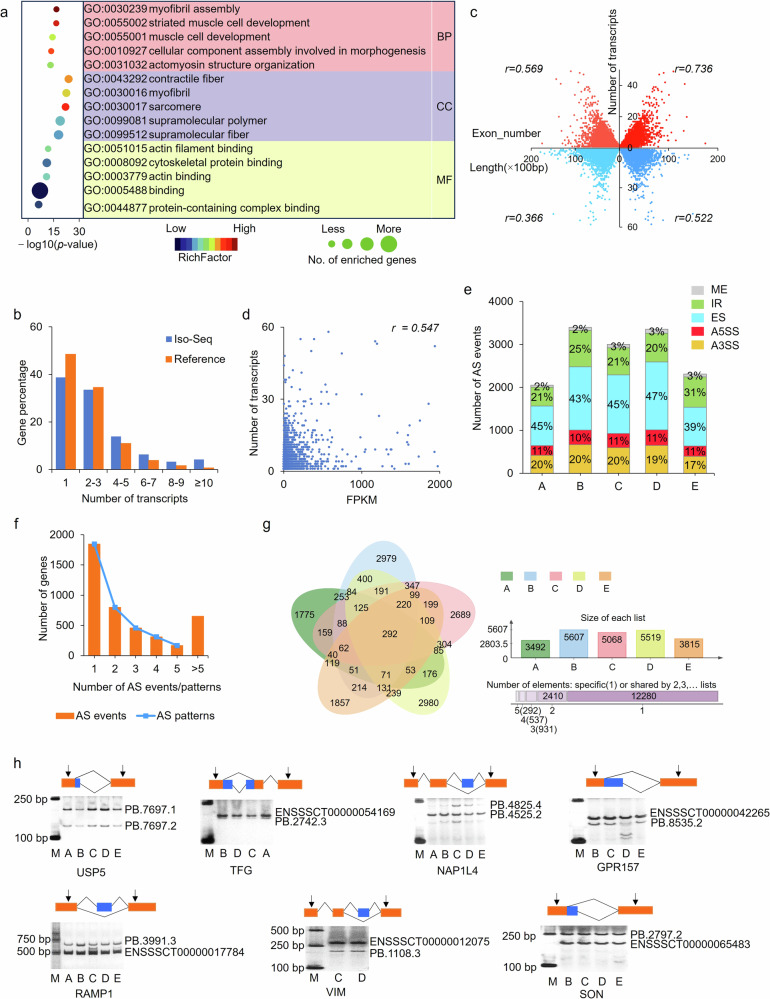
Fig. 2. Widespread transcript diversity was identified by Iso-Seq.
a GO terms enriched by the top 100 most isoformic genes. Top five terms are given in each category. b Distribution of number of transcripts among multi-exon genes. c Correlation analysis of number of transcripts with the number of exon and length of gene. d The Spearman Correlation analysis of the number of transcripts and FPKM of gene expression level. e Distribution of alternative splicing (AS) events among five developmental stages. f Distribution of AS events/patterns among genes. g Venn diagram of transcript among five developmental stages. h Validation of transcript diversity with RT-PCR method. In the legend, A, sample A (7-d-old pigs); B, sample B (30-d-old pigs); C, sample C (60-d-old pigs); D, sample D (90-d-old pigs); E, sample E (210-d-old pigs), the same as below.

