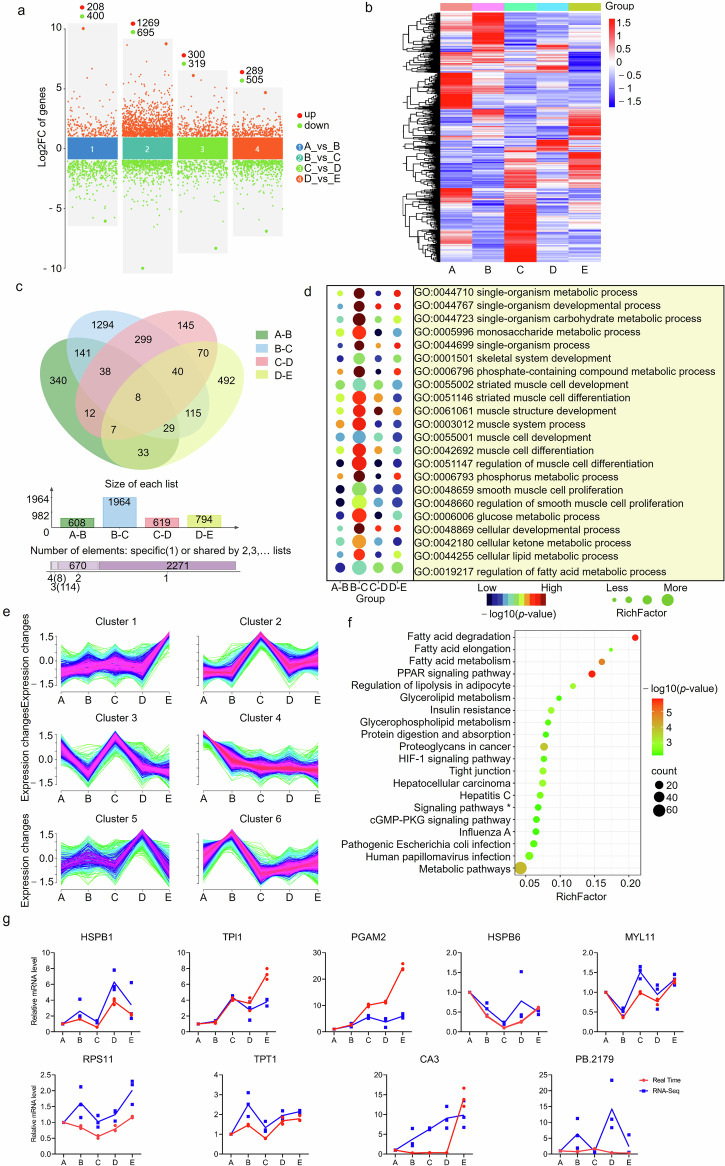
Fig. 3. Characterization of differentially expressed genes (DEGs) in pairwise groups of adjacent periods.
a Multi-volcano plot of DEGs identified in the four comparison groups. b Heatmap of all DEGs identified in the four comparison groups. c, Venn diagram of DEGs. d Significantly enriched GO terms related to muscle growth (p < 0.05). e Clustering of all DEGs based on the expression patterns at five developmental stages. f KEGG pathways enriched by DEGs in cluster 4. *Signaling pathways regulating pluripotency of stem cells. g Real-time PCR validation of RNA-Seq data. Values are expressed as the mean of n = 3 repeats.

