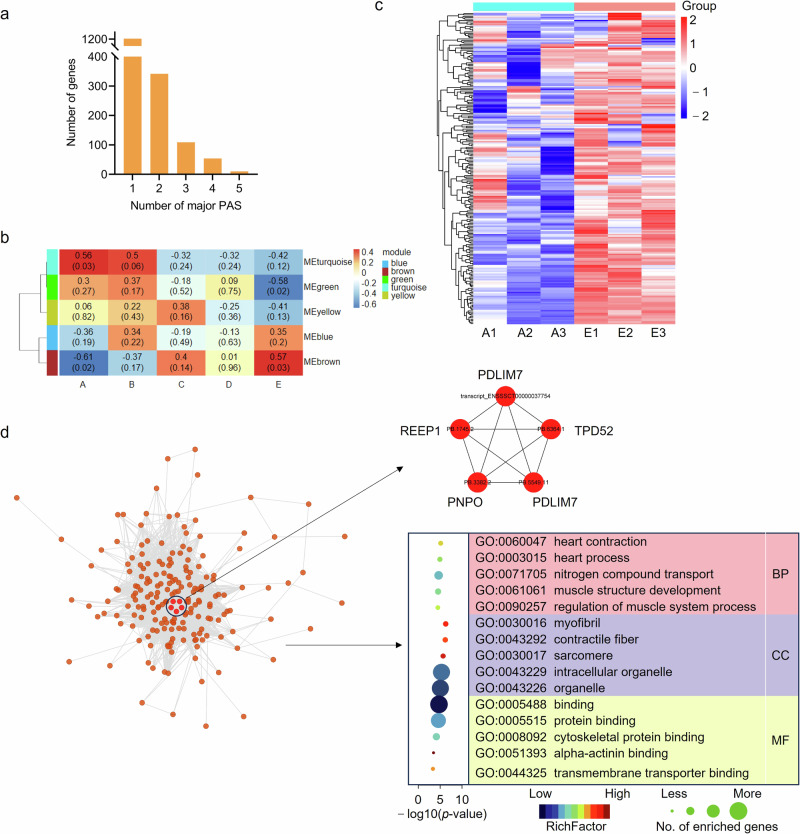
Fig. 7. Identification of PAS genes important for muscle development.
a Statistics of number of major PAS in genes identified among five developmental stages. b Module-trait association analysis. Each row represents a module, and column represents a trait; Blue and red color represent negative and positive correlation, respectively. c, Heatmap of transcripts clustered in Module brown. d Co-expression network characterizes hub transcripts in Module brown, and the following GO analysis shows the top 5 terms enriched by transcripts in the network.

