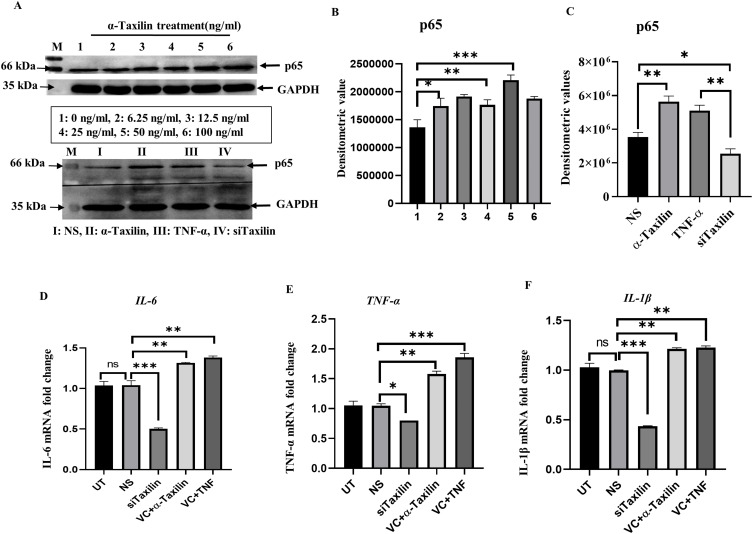
Figure 3.
α-Taxilin ameliorated inflammation in primary RAFLS. (A) Upper panel showing WB image of NF-kB p65 band along with GAPDH in different doses of α-Taxilin (1: 0ng/ml, 2: 6.25ng/ml, 3: 12.5ng/ml, 4: 25ng/ml, 5: 50 ng/ml, 6: 100ng/ml) induction, and the lower panel shows p-65 level along with GAPDH after knockdown of α-Taxilin (25nM) and induction of pure protein of α-Taxilin (50ng/ml) and TNF-α (20ng/ml). (B) Bar graph represents the densitometric values of p-65 level after different doses (1: 0ng/ml, 2: 6.25ng/ml, 3: 12.5ng/ml, 4: 25ng/ml, 5: 50ng/ml, 6: 100ng/ml) of α-Taxilin. (C) The bar graph represents p-65 level after knockdown of α-Taxilin and pure protein induction of TNF-α and α-Taxilin. (D) The bar graph represents IL-6 mRNA level after knockdown of α-Taxilin and pure protein induction of TNF-α and α-Taxilin along with control groups. (E) The bar graph represents TNF-α mRNA level after knockdown of α-Taxilin and pure protein induction of TNF-α and α-Taxilin along with control groups. (F) The bar graph represents IL-1β mRNA level after knockdown of α-Taxilin and pure protein induction of TNF-α and α-Taxilin along with control groups. (* P ≤0.05, ** P ≤0.01, *** P ≤0.001).
Abbreviations: WB, Western blot; ns, non-significant; NS, non-specific Si-RNA; TNF-α, tumor necrosis factor-α; VC, vehicle control; UT, untreated; kDA, kilo Dalton; GAPDH, glyceraldehyde 3-phosphate dehydrogenase; Il-6, Interleukin-6; IL1β, Interleukin-1-β; nM, Nano molar; ng, Nano gram; mL, milliliter.

