Figure 7.
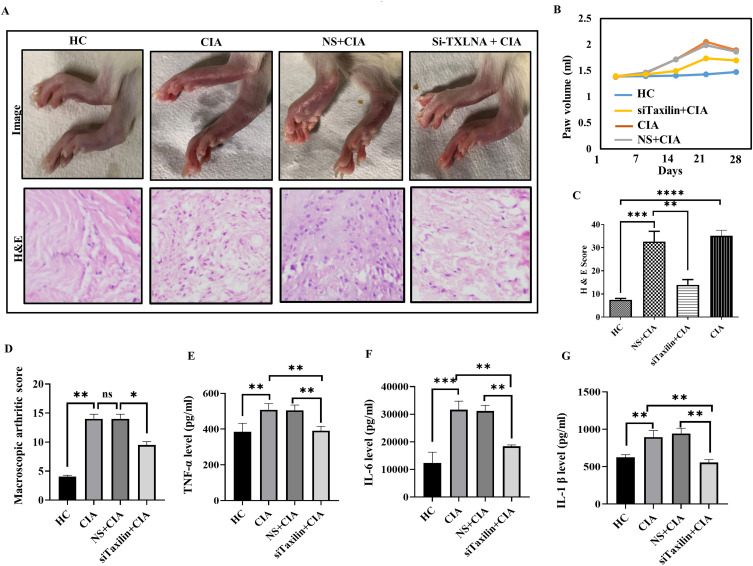
Alpha-Taxilin ameliorates RA-like symptom in CIA rats. (A) The upper panel shows a paw image taken on 28th day in HC, CIA, NS+CIA, and siTaxilin+CIA groups where the redness and swelling can be observed, whereas the lower panel shows histological evidence of cell infiltration in the synovium of respective groups. (B) Line graph indicating increased paw volume due to onset of inflammation and edema in CIA rats measured on day 1 to day 28 with intervals of 1 week. (C) The bar graph represents the infiltration of cells in the synovium of different rat groups after induction of collagen, based on calculated H&E score. (D) The bar graph shows macroscopic arthritis score based on macroscopic observation in rats, a decreased level of macroscopic arthritis score in the siTaxilin group compared to the CIA group was observed. (E) The bar graph showing TNF-α concentration in the rat’s plasma sample measured by ELISA, found downregulated in the knockdown group. (F) The bar graph showing IL-6 concentration in rat’s plasma sample measured by ELISA, found downregulated in the knockdown group. (G) The bar graph showing IL-1β concentration in rat’s plasma sample measured by ELISA, found downregulated in the knockdown group using siTaxilin. (* P ≤0.05, ** P ≤0.01, *** P ≤0.001, **** P ≤0.0001).
Abbreviations: HC, healthy control; NS, non-specific Si-RNA; CIA, collagen induced arthritis; H&E, Hematoxylin and Eosin; H&E, Hematoxylin and eosin staining; ns, Non-significant.

