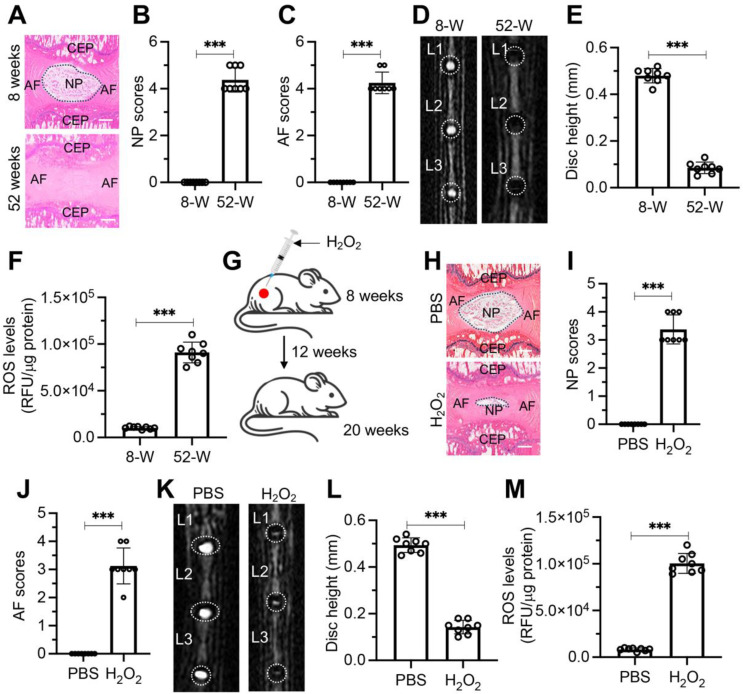
Fig. 1.
ROS accumulation resulted in IDD in mice. (A) Representative H&E stained sections of L1/L2 IVDs from mice aged 8 weeks and 52 weeks. Scale bars = 100 μm. (B) Quantitative scoring of the NP in degenerative IVDs shown in (A). (C) Quantitative scoring of the AF in degenerative IVDs illustrated in (A). (D) Representative MRI scans of lumbar IVDs ranging from L1 to L3 in mice aged 8 weeks and 52 weeks. (E) Measurement of disc height in L1/L2 IVDs comparing 8-week-old and 52-week-old mice. (F) Levels of ROS in lumbar IVDs of mice at 8 weeks and 52 weeks of age. (G) Schematic representation of H2O2 injection procedure near lumbar discs in mice. (H) Representative H&E staining images of lumbar IVDs (L1/L2) from mice administered with PBS and H2O2. Scale bars = 100 μm. (I) Quantified NP scores of IVDs demonstrating degeneration in mice treated as described in (H). (J) Quantified AF scores of IVDs showing degenerative changes in mice treated as indicated in (H). (K) Representative MRI scans of lumbar IVDs (from L1 to L3) in mice treated with PBS and H2O2. (L) Disc height measurements in L1/L2 IVDs from PBS and H2O2-treated mice. (M) ROS levels in lumbar IVDs of mice treated with PBS and H2O2. ***P < 0.001

