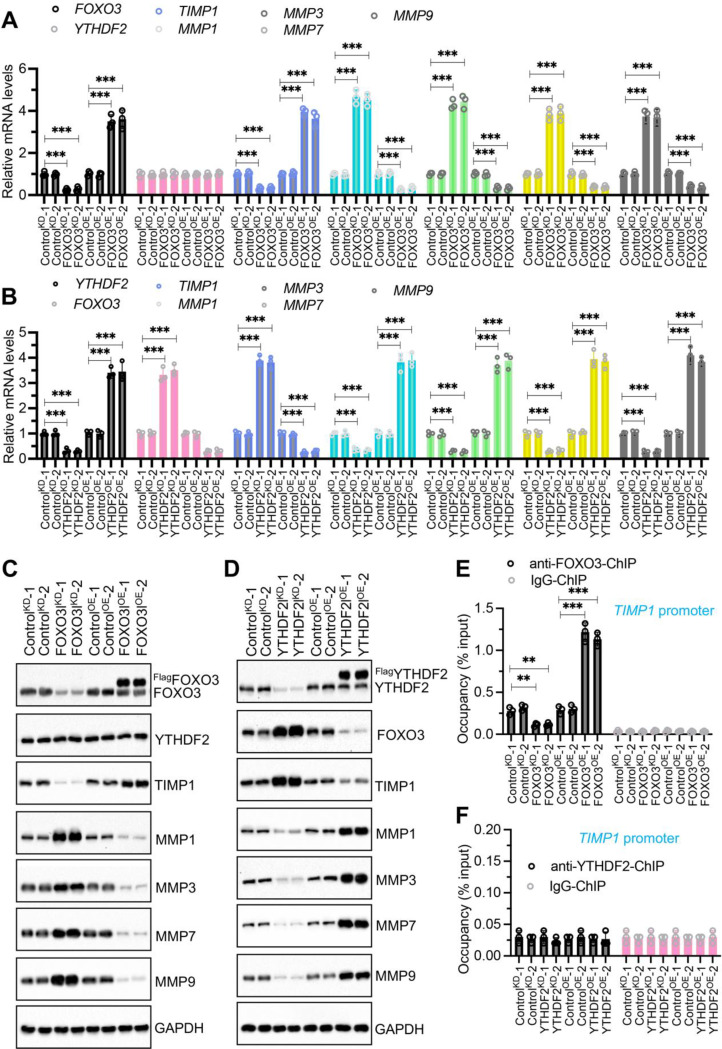
Fig. 4.
Impact of FOXO3 and YTHDF2 Knockdown and overexpression on the expression of TIMP1 and MMPs. (A) mRNA expression levels of YTHDF2, TIMP1, and MMPs in FOXO3KD and FOXO3OE cells. Quantitative PCR was performed on RNA from control knockdown (ControlKD-1 and ControlKD-2), FOXO3 knockdown (FOXO3KD-1 and FOXO3KD-2), control overexpression (ControlOE-1 and ControlOE-2), and FOXO3 overexpression (FOXO3OE-1 and FOXO3OE-2) cell lines (NP background) to assess levels of FOXO3, YTHDF2, TIMP1, MMP1, MMP3, MMP7, and MMP9. (B) mRNA expression levels of FOXO3, TIMP1, and MMPs in YTHDF2KD and YTHDF2OE cells. RNA from ControlKD-1/2, YTHDF2KD-1/2), ControlOE-1/2, and YTHDF2OE-1/2 cell lines (NP background) was analyzed to detect the expression levels of the same genes as in (A) by RT-qPCR. (C) Protein expression of YTHDF2, TIMP1, and MMPs in FOXO3KD and FOXO3OE cells. Protein samples from cells in (A) were analyzed by Western blot to detect levels of the indicated proteins. (D) Protein expression of FOXO3, TIMT1, and MMPs in YTHDF2KD and YTHDFOE cells. Protein samples from cells in (B) were subjected to Western blot analysis to detect levels of the indicated proteins. (E) The binding of FOXO3 on the promoter of TIMP1 by ChIP assay using cells in (A). (F) The binding of YTHDF2 on the promoter of TIMP1 by ChIP assay using cells in (B). **P < 0.01, ***P < 0.001

