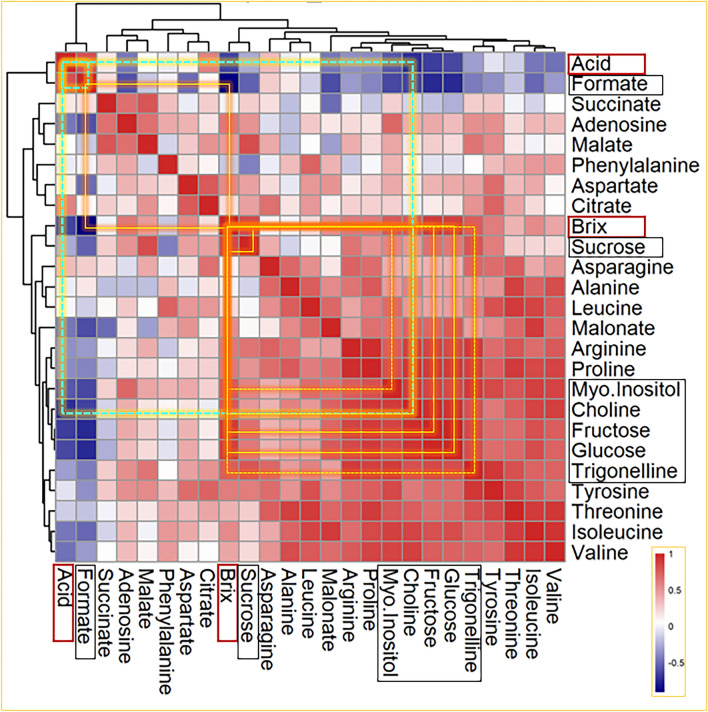
Fig. 5.
Correlation between Brix/Acid and metabolites: Heatmap depicts the correlation (Pearson) of the time-dependent variation of the Brix and Acid tests and the NMR-measured metabolites. The dendrograms (hierarchical clustering by Euclidean distance) identify sub-groups of correlated measurements. Metabolites that have a positive or negative correlation with Brix are shown as yellow squares, and with Acid are shown as green squares. Continuous lines have correlation coefficients > 0.8 and p-values < 0.05, while the dashed lines 0.7 < correlation coefficient < 0.8 and 0.05 < p-values < 0.1.

