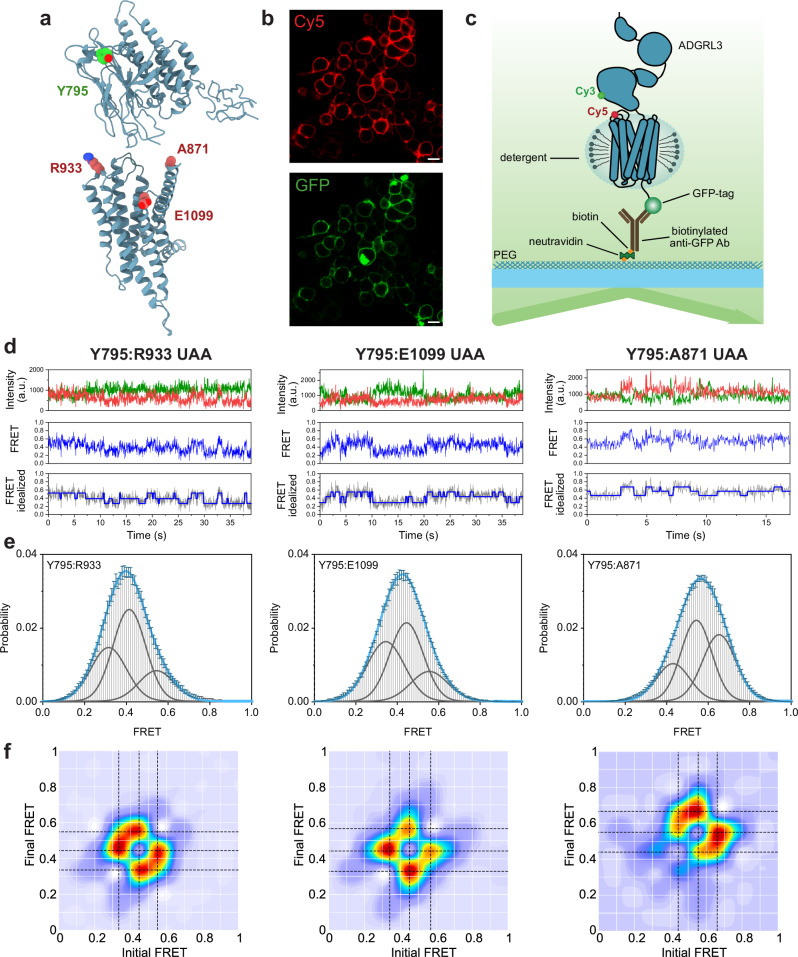
Fig. 4. smFRET present three stable conformations of ADGRL3 ECR/7TM.
a Hypothetical model of ADGRL3 (containing HormR, GAIN, and 7TM domains) showing positions of amino acids that were replaced by UAA in making of the smFRET sensor pairs: Y795 (in green), R933, E1099, A871 (in red). b Example of confocal microscopy images of ADGRL3-UAA labeled with Cy5 (red) showing membrane expression and GFP (green) showing overall expression of the receptor. Images are representative samples of n = 3, independent biological replicates. Scale bar: 10 µm. c Schematic of SiMPull smFRET TIRF microscopy experiment. d Representative smFRET traces of Y795:R933 UAA, Y795:E1099 UAA, and Y795:A871 UAA, showing donor (green) and acceptor (red) intensities, corresponding FRET (blue), and idealized FRET trace (blue line over gray FRET data) from HMM. e Single-molecule FRET population histograms of Y795:R933 UAA, Y795:E1099 UAA, Y795:A871 UAA, respectively (error bars represent s.e.m., n = 3, independent biological replicates). Three single Gaussian distributions (gray) were fitted to the histograms. Peaks are centered at 0.32, 0.41, and 0.54 for Y795:R933 UAA, 0.35, 0.44, and 0.55 for Y795:E1099 UAA, and 0.45, 0.55, 0.65 for Y795:A871 UAA. The cumulative fit is overlaid in blue. Source data are provided as a Source Data file. f Transition density plots of Y795:R933 UAA, Y795:E1099 UAA, and Y795:A871 UAA, respectively (n = 3, independent biological replicates). Dashed black lines cross the most observed transitions between different states and were considered in the multiple-peak fitting of smFRET histograms.

