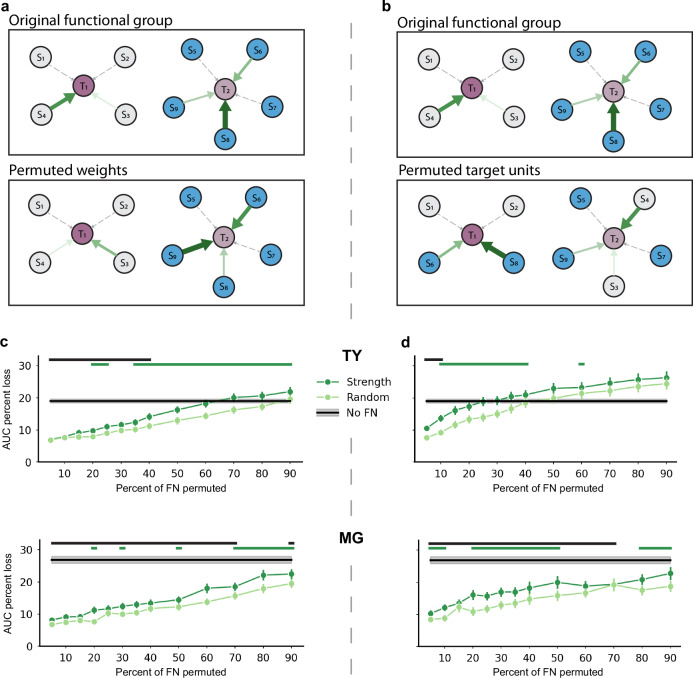
Fig. 4. The topology of strong functional interactions underlies accurate prediction of single-sample activity.
a Diagram of weight permutation. Top: two original functional groups of source units (Sn) and their input edge weights to target units (Tn). Solid green arrows indicate membership in the strongest N% of edge weights, with larger and darker arrows indicating a larger weight. Dashed gray arrows constitute the remaining edges in the FN. Bottom: the strongest edges were permuted freely, even across functional groups, while source-target unit pairs were unchanged within functional groups. Note that for simplicity the diagram does not depict reciprocal connections or the interconnectivity of functional groups. b Top: same original functional group shown in (a). Bottom: source-weight pairs were held constant, but the target unit receiving input from the pair was permuted freely. In other words, source-weight pairs were reassigned to a new target unit, resulting in entirely new functional groups. c Top: percent AUC loss on the original training set (mean ± sem for across 175 units at each percent) resulting from permuting the strongest N% of weights (dark green) or a random N% (light green) versus the size of the permuted functional group for monkey TY. The black line with gray shading indicates the AUC loss due to removal of all network terms (No FN, mean ± sem, 175 units). Green lines above the plot indicate functional group sizes for which permuting the strongest weights resulted in significantly greater loss than permuting random weights (p < 0.01, one-sided sign test, with exact p-values provided in the Source Data file). Black lines indicate group sizes for which the effect of removing the network feature terms entirely was significantly greater than permuting the strong weights (p < 0.01). Bottom: same for monkey MG, showing percent AUC loss due to permutations and with No FN as mean ± sem across 73 units. d Same as (c) for the effect of permuting target units in the original functional groups. Source data are provided as a Source Data file.

