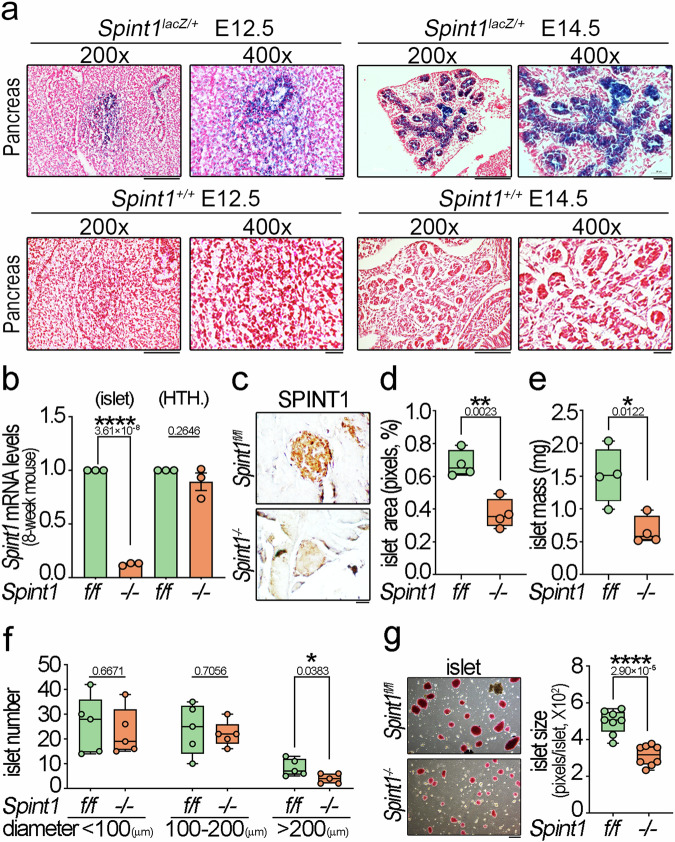
Fig. 1. Expression patterns of Spint1-lacZ in Spint1lacZ/+ mouse embryonic pancreas and the islet phenotypes resulting from pancreas-specific Spint1-deficiency in 8-week-old mice.
a Representative LacZ-stained sections showed distinctive Spint1-lacZ expression patterns in the pancreas of E12.5 and E14.5 Spint1lacZ/+ embryos. Notably, prominent LacZ signals were observed in the E14.5 pancreas, encompassing the primordial pancreatic duct, its branches, and the acini-like structures budding from the ductal tip region. The bottom panel illustrated images of Spint1+/+ counterparts. Scale bar, 100 μm for 200× panels and 20 μm for 400× panels. b Validation of tissue-specific disruption of Spint1 in the mouse pancreatic islets using Q-RT-PCR. RNAs were extracted from the 8-week-old Spint1fl/fl and Spint1−/− mouse pancreatic islets (left panel) and hypothalamus (HTH., right panel) and subjected to reverse transcription and Q-RT-PCR with normalization to Gapdh. Data were obtained from three independent experiments (three mice per group). c Immunohistochemical analysis of SPINT1 in the pancreatic islets of 8-week-old Spint1fl/fl and Spint1−/− mice. Scale bar, 20 μm. d Quantification of islet area percentage in 8-week-old Spint1fl/fl and Spint1−/− mice. Each pancreas was serially sectioned (300 sections per pancreas, 5 μm per section), and one out of every 60 serial sections (300 μm intervals) was taken for H&E staining to reveal islet areas. ImageJ determined the percentage of islet area in a whole pancreas area based on the merged full-view microscopic images of 6 sections per mouse (four mice per group). e Analysis of islet mass in 8-week-old Spint1fl/fl and Spint1−/− mice. The islet mass was calculated by multiplying the islet area percentage in (d) by pancreas weight in Supplementary Fig. 3g (n = 4 per group). f Measurement of islet numbers in the pancreas of 8-week-old Spint1fl/fl and Spint1−/− mice. The islets with a diameter below 100 μm were defined as small islets, those with a diameter between 100 and 200 μm as medium islets, and those with a diameter above 200 μm as large islets. The islet numbers with different diameters were measured using microscopic images from H&E-stained sections using ImageJ (one out of every 300 μm interval from serial sections of each pancreas, 6 sections per mouse, 5 mice per group). g Quantification of islets sizes in 8-week-old Spint1fl/fl and Spint1−/− mice. Pancreatic islets were isolated after collagenase perfusion (details in the Methods section) and stained with dithizone solution (7.5 mg/mL). The islet images (left panel, 4 low-power fields per pancreas) were taken under a dissecting microscope and subjected to size measurement (average islet area in pixels per islet) using ImageJ (right panel, n = 8 per group). Statistical significance was assessed by a two-tailed Student’s t-test for all quantifications. For the bar plot, bars are represented as mean ± SEM. In the box plots, the boxes span from the 25th to the 75th percentiles, with a line indicating the median. Whiskers extend to values within 1.5 times the interquartile range, defined as the difference between the 25th and 75th percentiles. Scale bar, 50 μm. *P < 0.05; **P < 0.01; ****P < 0.0001. Below the asterisks are the precise statistical results. Source data are provided as a Source Data file.

