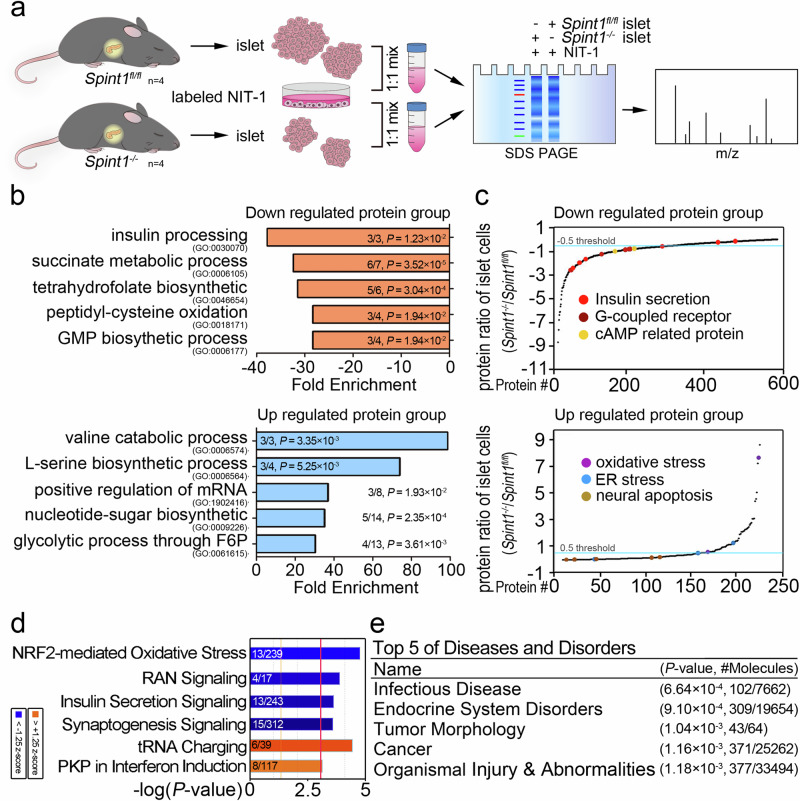
Fig. 3. Quantitative proteomic analysis of Spint1fl/fl and Spint1−/− islets using an alternative SILAC method.
a SILAC workflow for the proteomic analysis of Spint1fl/fl and Spint1−/− islets (4 mice per group). b Gene ontology (GO) analysis of the biological processes for differentially regulated proteins in the SILAC analysis of Spint1fl/fl and Spint1−/− islets. The biological processes significantly affected the downregulated and upregulated protein groups in Spint1−/− pancreatic islets compared to Spint1fl/fl islets listed in the upper and lower panels, respectively. The fractions in the histograms represent the proportion of identified proteins (numerator) in our dataset that correspond to those pathways, with the denominator indicating the total number of proteins in each pathway. c Protein abundance differences between Spint1fl/fl and Spint1−/− islets. The graph was generated using the Kyoto Encyclopedia of Genes and Genomes (KEGG) analysis of the biological pathways for the differentially regulated proteins between Spint1fl/fl and Spint1−/− islets. The differentially regulated proteins were divided into the downregulated (upper panel) and upregulated (lower panel) groups in Spint1−/− islets. The biological pathways with significant alteration in this study (e.g., insulin-related pathways) are highlighted with color dots in the graphs. d Analysis of the most highly regulated signal pathways using ingenuity pathway analysis (IPA) to examine the proteins differentially expressed in Spint1−/− islets relative to Spint1fl/fl islets. The top six differentially regulated signal pathways were identified using the threshold of −log (P value) >3. Downregulated pathways are represented by blue bars, while upregulated pathways are indicated by orange bars in Spint1−/− islets compared to Spint1fl/fl islets. The fractions in the histograms show the proportion of the identified proteins (numerator) in our database that correspond to those pathways, with the denominator indicating the total number of proteins in each pathway. e Top five diseases and disorders identified through IPA of the differentially regulated proteins in Spint1−/− islets compared to Spint1fl/fl islets. The fractions in the table represent the number of the identified proteins associated with various diseases and disorders (numerator) relative to the total number of proteins for the corresponding disease and disorder in the IPA dataset (denominator). Statistical analysis was performed using a two-sided Fisher’s exact test, and the false discovery rate was controlled using the Benjamini–Hochberg procedure to correct p values (P) for (b, d, e). Source data are provided as a Source Data file.

