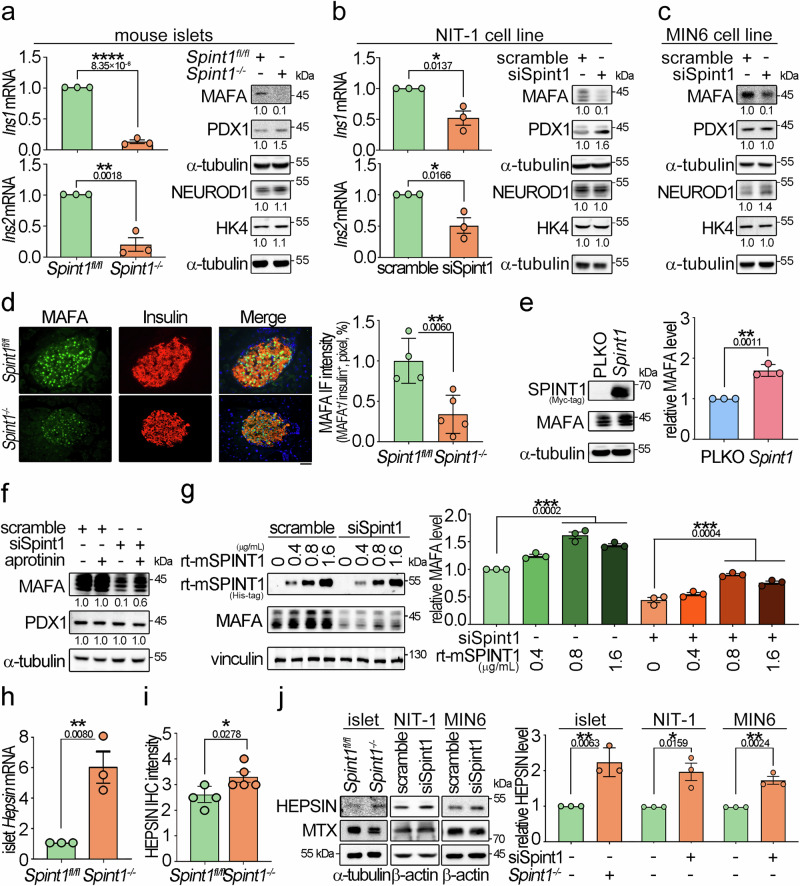
Fig. 4. Downregulation of MAFA in Spint1-depleted mouse β cells accompanied by HEPSIN upregulation.
a Expression levels of Ins1/2 mRNA, three key transcription factors for insulin expression, and a glucose sensor in Spint1fl/fl and Spint1−/− mouse islets. The expression levels of insulin (Ins1 and Ins2) in mouse islets were examined using Q-RT-PCR with normalization to Gapdh (n = 3 per group, left panels). The protein levels of transcription factors (MAFA, PDX1, and NEUROD1) for insulin expression and a glucose sensor (glucokinase, HK4) were analyzed in collected mouse islets using immunoblot assays (n = 6 mice per group). α-tubulin was used as a loading control. b Effect of Spint1 silencing on the expression levels of Ins1, Ins2, MAFA, PDX1, NEUROD1, HK4, and α-tubulin in NIT-1 cells (n = 3 per group). c Effect of Spint1 silencing on the expression levels of MAFA, PDX1, NEUROD1, HK4, and α-tubulin in MIN6 cells (n = 3 per group). d Immunofluorescence staining of MAFA and insulin in 8-week-old Spint1fl/fl and Spint1−/− mouse islets. Pancreatic sections were subjected to immunofluorescence staining of MAFA (green) and insulin (red). The images were then taken using a fluorescence microscope. Scale bar, 20 μm. The right histogram represented the relative intensity of MAFA in β cells (three sections per pancreas, four mice for Spint1fl/fl, five mice for Spint1−/− mice). e Effect of Spint1 overexpression on MAFA expression in NIT-1 cells. Cells were transiently transfected with Spint1 plasmids with a MYC tag and control vectors (PLKO). Cell lysates were subjected to immunoblot analysis using anti-MYC and anti-MAFA antibodies. α-tubulin was used as a loading control. MAFA protein levels were then quantified and statistically calculated from three independent experiments with normalization to α-tubulin and relative to PLKO control (right panel, n = 3). f Effect of a broad serine protease inhibitor (aprotinin) on the expression of MAFA in Spint1-silencing NIT-1 cells. siSpint1- or scrambled siRNA-transfected NIT-1 cells were treated with or without 40 μg/mL aprotinin for 24 h. Cell lysates were subjected to immunoblot analysis using anti-MAFA and anti-PDX1 antibodies. α-tubulin was used as a loading control. MAFA and PDX1 protein levels were statistically calculated from three independent experiments and shown at the bottom of each image. g Effects of recombinant mouse SPINT1 proteins (rt-mSPINT1) on the MAFA expression in Spint1-depleted NIT-1 cells. Cells were transfected with siSpint1 and scramble siRNAs, cultured for 24 h, and then treated with 0, 0.4, 0.8, and 1.6 μg/mL rt-mSPINT1 for another 24 h. Cell lysates were subjected to immunoblot analysis using anti-MAFA and anti-His-tag antibodies. Vinculin was used as a loading control. MAFA protein levels were statistically calculated from three independent experiments with normalization to vinculin (right panel). The recombinant protein and anti-His-tag antibody products are listed in Supplementary Table 3. h Analysis of Hepsin expression in 8-week-old Spint1fl/fl and Spint1−/− mouse islets using Q-RT-PCR. Results were statistically calculated from three independent experiments. i Quantification of HEPSIN IHC intensity in Spint1fl/fl and Spint1−/− mouse islets. HEPSIN protein levels in Spint1fl/fl and Spint1−/− mouse islets were examined using IHC and shown in Supplementary Fig. 6e. HEPSIN intensities in Spint1fl/fl and Spint1−/− mouse islets were statistically calculated using ImageJ from three sections per mouse pancreas (n = 4 for Spint1fl/fl mice, n = 5 for Spint1−/− mice). j Immunoblot analysis of HEPSIN and matriptase (MTX) in mouse islets, NIT-1, and MIN6 cells. Lysates were collected from Spint1fl/fl and Spint1−/− mouse islets (left panel), NIT-1 and MIN6 cells (middle and right panels) with or without Spint1 silencing (siSpint1 versus scramble) and subjected to immunoblot analysis using anti-HEPSIN and anti-MTX antibodies. α-tubulin or β-actin was used as a loading control. The histogram (right panel) represents the quantification result of HEPSIN levels in the left panels. Data were statistically calculated with normalization to β-actin or α-tubulin from three independent experiments (n = 3 per group of mice or cell cultures). Statistical significance was assessed by a two-tailed Student’s t-test for all panels. All data were represented as mean ± SEM. *P < 0.05; **P < 0.01; ****P < 0.0001. Below the asterisks are the precise statistical results. Source data are provided as a Source Data file.

