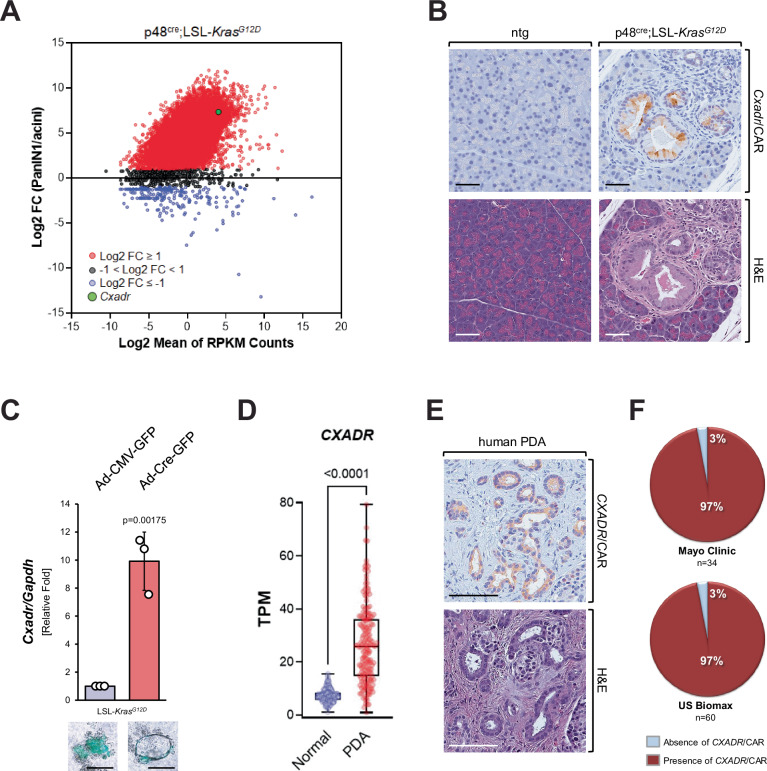
Fig. 1. Oncogenic KRas-expressing mouse PanIN cells upregulate CAR, which is expressed in human PDA.
A PanIN1 and acini were microdissected from KC (p48cre;LSL-KrasG12D) mice and subjected to RNA-seq analyses. Shown is a graphical representation of the relative abundance of transcripts. RNA-seq data were averaged from 40 laser-dissected PanIN1 lesions and an equivalent area with normal acini. Data were filtered to exclude transcripts with a sum RPKM < 0.5 so as to eliminate transcripts at/or below the limits of detection, and 20,037 transcripts remained after filtering. Shown is a plot of the ratio of the averages of the individual transcripts in both sample types, expressed as log2-fold change (FC) PanIN/acini. Black dots represent log2 FC < 3, red dots 3 ≤log2 FC < 7 and blue dots log2 FC ≥ 7. The green dot indicates Cxadr/CAR. Source data are provided as a Source Data file. RNAseq raw data can be accessed in Gene Expression Omnibus (GEO) using accession code GEO:GSE280352. B Pancreatic tissues of p48cre;LSL-KrasG12D and ntg control mice were analyzed by IHC for expression of CAR (brown) in acinar cell regions or PanIN lesions. The bottom pictures show H&E staining of a serial section. Shown are representative pictures of n = 4 biological replicates (ntg or KC mice). C Primary acini were isolated from an LSL-KrasG12D mouse and infected with adenovirus harboring GFP (control) or GFP and cre (GFP;cre). Cells were embedded in collagen (3D culture). After 5 days, cells/structures were photographed to show GFP expression (bottom, representative pictures, scale bar indicates 50 µm) and then harvested and subjected to quantitative RT-PCR analysis for Cxadr/CAR and GAPDH. The bar graph shows data from n = 3 biological replicates. Data are presented as mean values ± SD. Statistical significance (p = 0.00175) was determined using a two-sided t-test. Source data are provided as a Source Data file. D CXADR expression in normal (n = 195) and tumor (n = 176) samples from the TCGA TARGET GTEx dataset where the midline of the box represents the median. The whiskers extend to min and max. Outliers were removed via ROUT (Q = 1%) and statistical significance (p < 0.0001) was determined using a two-sided t-test. Source data are provided as a Source Data file. E, F Tissue microarrays containing human PDA samples (US Biomax n = 60 samples; Mayo Clinic n = 34 samples) were analyzed by IHC for expression of CAR. E shows an example of an IHC for CAR (brown, top) and H&E staining of a serial section (bottom). F shows the quantification of CAR expression in both TMAs. Source data are provided as a Source Data file.

