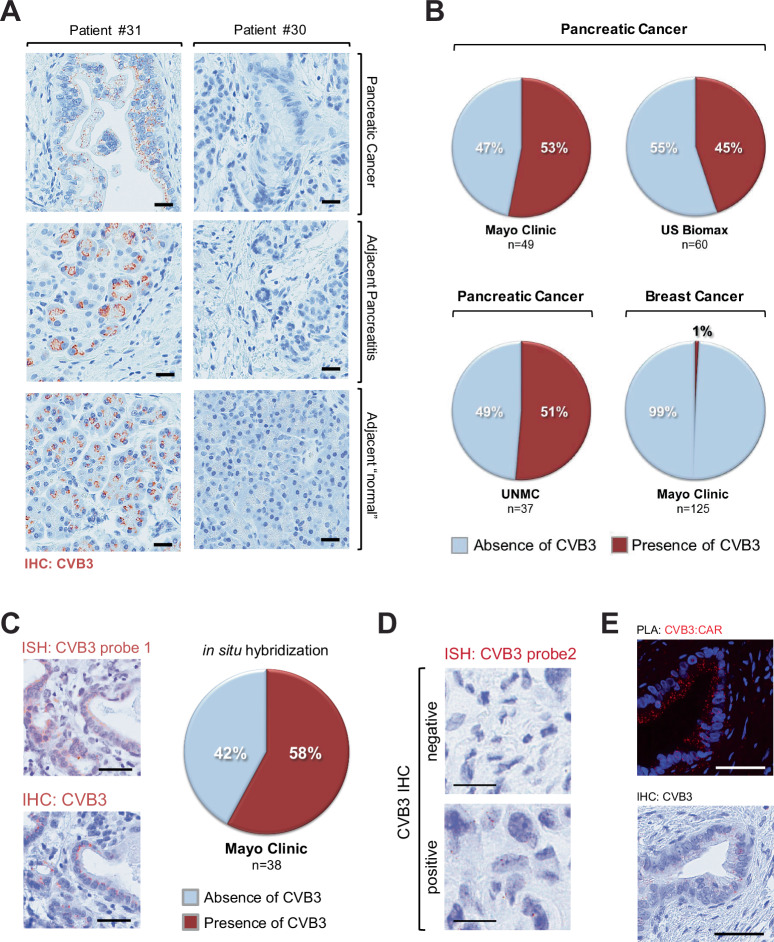
Fig. 2. Incidence of coxsackievirus B3 infection in pancreatic cancer patients.
A Tissue samples from human pancreatic cancer patients (n = 49) were analyzed by IHC for the presence of CVB3. Shown are areas of pancreatic cancer, adjacent pancreatitis, and “normal” acinar areas from tumors of the same patient. The left side row shows a patient positive for CVB3 (brown dots) and the right side row a patient negative for CVB3. B Tissue microarrays from different sources containing human PDA samples (US Biomax n = 60 samples; Mayo Clinic n = 49 samples, UNMC n = 37 samples) or breast cancer samples (Mayo Clinic n = 125 samples) were analyzed by IHC for the presence of CVB3. Quantifications show a % absence or presence of CVB3. Source data are provided as a Source Data file. C Serial sections of TMAs containing human PDA samples (Mayo Clinic n = 38 samples) were subjected to ISH probe 1 (top picture) or IHC (bottom picture) for CVB3. The scale bar indicates 50 µm. The pie graph shows the % presence or absence of CVB3 for the in situ hybridization data. Source data are provided as a Source Data file. D Human samples that were either positive or negative for CVB3 immunohistochemistry were analyzed with a second ISH probe (CVB3 probe2). Brown dots indicate CVB3 RNA. The scale bar indicates 10 µm. E Shows one of 3 biological repeats of a proximity ligation assay (PLA) in which samples were stained for the interaction of CVB3 and CAR. Red dots show the interaction (CVB3:CAR) of both molecules. The bottom picture shows an IHC for CVB3 in a serial section. The scale bar indicates 50 µm.

