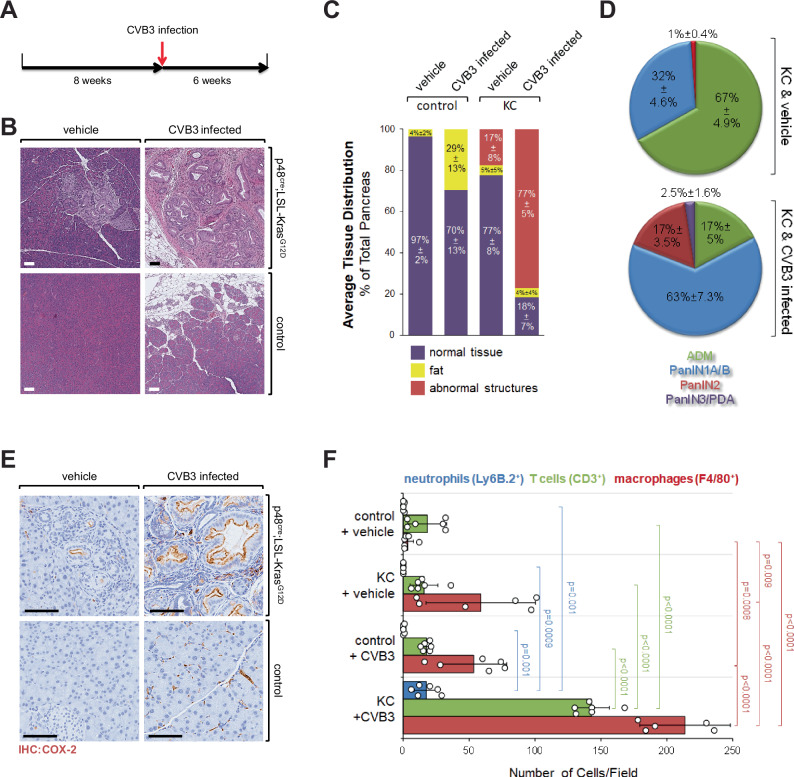
Fig. 3. A single CVB3 infection in the presence of KRasG12D rapidly leads to pancreatic cancer.
A Scheme of the animal experiment. Mice at 8 weeks of age were infected with CVB3 once. After 6 weeks, pancreata were harvested and analyzed. B Pancreatic tissues of KC or control mice, either vehicle-treated or infected with CVB3, were stained with H&E. Pictures show a representative area of the pancreas. The bar indicates 100 µm. C Quantification of normal pancreas area, fat area, and areas with abnormal structures of n = 5 mice per group. Abnormal Structures: 3 vs. 4, p < 0.0001. Normal Tissue: 1 vs. 2, p = 0.0025; 1 vs. 3, p = 0.0006; 1 vs. 4, p < 0.0001; 2 vs. 4, p < 0.0001; 3 vs. 4, p < 0.0001; others: ns. Fat: 1 vs. 2, p = 0.0025; 2 vs. 3, p = 0.0053; 2 vs. 4, p = 0.0038; others = ns. Statistical significance between the two groups was determined using a two-sided t-test. Source data are provided as a Source Data file. D Quantification of ADM, PanIN1A/B, PanIN2, and PanIN3/PDA in KC & vehicle versus KC & CVB3 mice (n = 5 mice per group; see Supplementary Fig. S4 for individual mice and sex of mice). ADM p < 0.0001; PanIN1A/B p < 0.0001; PanIN2 p < 0.0001; PanIN3/PDA p = 0.0088. Statistical significance between the two groups was determined using a two-sided t-test. Source data are provided as a Source Data file. E Pancreatic tissues of KC or control mice, either vehicle treated or infected with CVB3, were stained by IHC for COX-2 expression. Shown are representative micrographs of n = 4 mice per group. The bar indicates 100 µm. F Pancreatic tissues of KC or control mice either vehicle treated or infected with CVB3 were stained by IHC for expression of Ly6B.2, CD3 or F4/80. The bar graph shows a quantification of n = 6 samples (individual data points shown as dots) per indicated group (bars: blue—neutrophils, green—T cells, red—macrophages). Data are presented as mean values ± SD. Statistical significance between two groups was determined using a two-sided t-test and p values are indicated in the bar graph. Source data are provided as a Source Data file.

