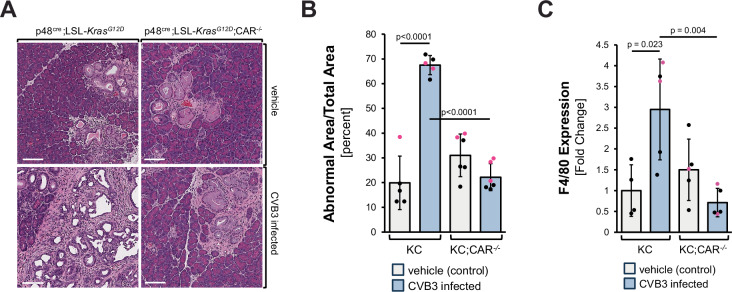
Fig. 4. Acinar cell-specific deletion of CAR blocks progression.
A KC or KC;CAR−/− mice at 8 weeks of age were infected with CVB3 once. After 6 weeks, pancreata were harvested and stained with H&E. Pictures show a representative area of the pancreas. The bar indicates 100 µm. B The bar graph shows analyses of the abnormal (fibrotic lesion) areas of pancreata of n = 5 or 6 mice per group (as indicated by the dots). Data are presented as mean values ± SD. Statistical significance between two groups was determined using a two-sided t-test and p-values are included in the graph. Sex of animals is indicated by the dot color (female—red; male—black). Source data are provided as a Source Data file. C Pancreatic tissues of KC or KC; CAR−/− mice either vehicle-treated or infected with CVB3 were analyzed for the presence of macrophages (F4/80). The bar graph shows analyses of the abnormal (fibrotic lesion) areas of pancreata of n = 4 (vehicle control) or n = 5 mice (other groups) per group (as indicated by the dots). Data are presented as mean values ± SD. Statistical significance between the two groups was determined using a two-sided t-test, and p-values are included in the graph. The sex of animals is indicated by the dot color (female—red; male—black). Source data are provided as a Source Data file. An accompanying representative IHC is shown in Supplementary Fig. S8C.

