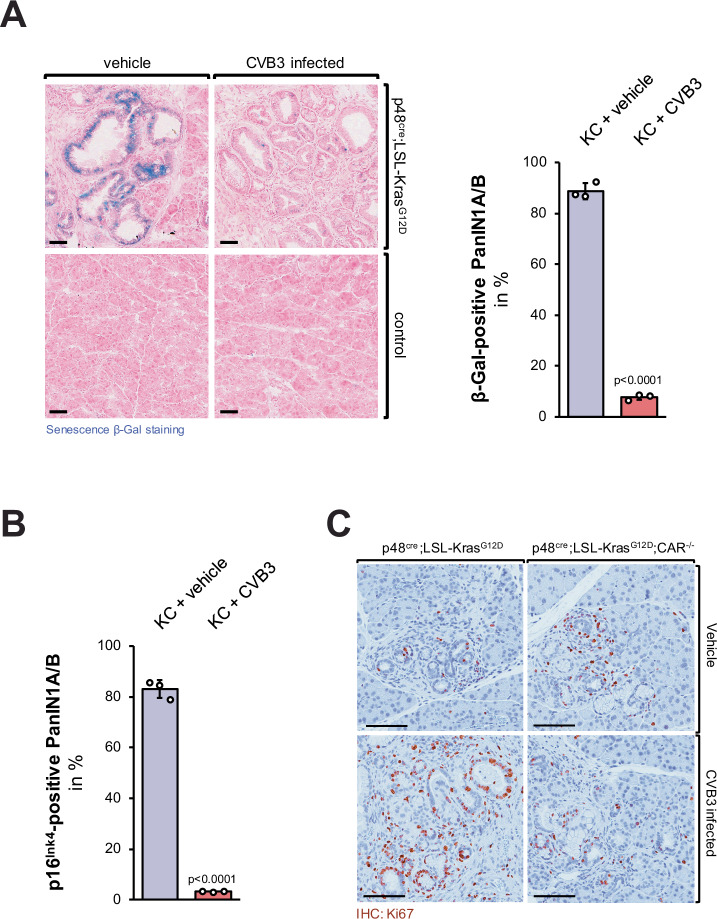
Fig. 5. CVB3 infection of KC mice leads to a decrease of the senescence barrier and increased proliferation of lesion cells.
A Pancreatic tissues of KC or control mice, either control-treated or infected with CVB3, were stained with the Senescence β-Gal Staining kit (Cell Signaling) and then counterstained with Nuclear Fast Red. The bar indicates 50 µm. The bar graph shows a quantification of n = 3 individual samples per indicated group. Data are presented as mean values ± SD. p < 0.0001 (two-sided t-test) indicates statistical significance. Source data are provided as a Source Data file. B Pancreatic tissues of KC or control mice either vehicle-treated or infected with CVB3, were analyzed by IHC for the presence of p16Ink4 (CDKN2). The bar graph shows a quantification of n = 3 individual samples per indicated group. Data are presented as mean values ± SD. p < 0.0001 (two-sided t-test) indicates statistical significance as compared to the vehicle-treated control mice. Source data are provided as a Source Data file. C Pancreatic tissues of KC or KC; CAR−/− mice either vehicle-treated or infected with CVB3, were stained proliferating cells (IHC for Ki67). Shown are representative pictures of lesion areas. The bar indicates 100 µm. The corresponding analysis is shown in Supplementary Fig. S10B.

