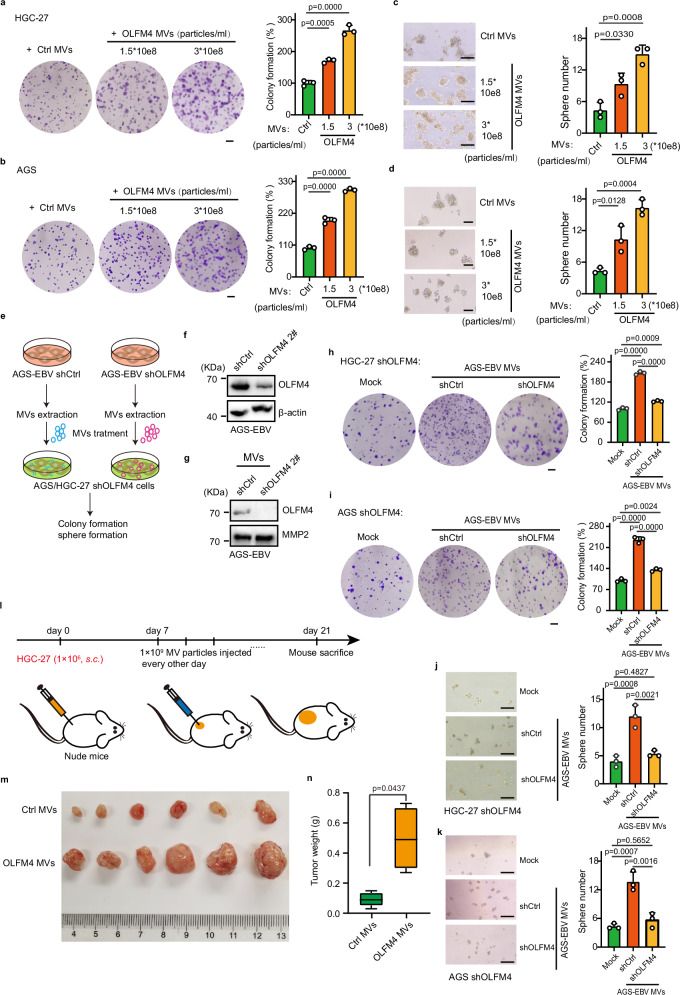
Fig. 5. OLFM4 over expressing MV promotes gastric cancer progression.
a Colony formation in HGC-27 cells treated with OLFM4-overexpressing MVs (n = 3 biological replicates/group). Scale bars, 1.5 mm. b Colony formation in AGS cells treated with OLFM4-overexpressing MVs (n = 3 biological replicates/group). Scale bars, 1.5 mm. c Sphere formation in HGC-27 cells after treatment with OLFM4-overexpressing MVs (3 replicates/group). Scale bars, 200 μm. d Sphere formation in AGS cells treated with the indicated MVs (n = 3 biological replicates/group). Scale bars, 200 μm. e Experimental workflow. f Immunoblotting showing intracellular OLFM4 levels in OLFM4-knockdown AGS-EBV cells. Scramble shRNA is used as a control. g Immunoblotting showing the levels of OLFM4 in MVs derived from OLFM4-knockdown AGS-EBV cells. Each lane is loaded 2 × 10⁸ MVs particles. h Colony formation of OLFM4-knockdown HGC-27 cells treated with the indicated MVs (n = 3 biological replicates/group). MVs are purified from shCtrl or shOLFM4-transfected AGS-EBV cells. Scale bars, 1.5 mm. i Colony formation ability of OLFM4-knockdown AGS cells treated with the indicated MVs (n = 3 biological replicates/group). Scale bars, 1.5 mm. j Sphere formation ability in OLFM4-knockdown HGC-27 cells after treatment with the indicated MV (n = 3 biological replicates/group). Scale bars, 200 μm. Sphere formation ability in OLFM4-knockdown AGS (k) cells after treatment with the indicated MV (n = 3 biological replicates/group). Scale bars, 200 μm. l Schematic illustration of subcutaneous tumorigenesis model and intratumoral MV injection in nude mice. m Representative images showing the tumor formation in HGC-27 after injection with OLFM4-expressing MV (n = 6 mice/group). n Box plot showing tumor weight in the indicated group. The center line corresponds to the median and box corresponds to the interquartile range. Representative of two independent experiments (a–j). Data are presented as mean ± s.d., analyzed for significant differences by performing two-tailed, unpaired Student’s t tests (n) or one-way ANOVA with Dunnett’s post hoc analysis (a–d, h–j).

