© The Author(s) 2024
Open Access This article is licensed under a Creative Commons Attribution-NonCommercial-NoDerivatives 4.0 International License, which permits any non-commercial use, sharing, distribution and reproduction in any medium or format, as long as you give appropriate credit to the original author(s) and the source, provide a link to the Creative Commons licence, and indicate if you modified the licensed material. You do not have permission under this licence to share adapted material derived from this article or parts of it. The images or other third party material in this article are included in the article’s Creative Commons licence, unless indicated otherwise in a credit line to the material. If material is not included in the article’s Creative Commons licence and your intended use is not permitted by statutory regulation or exceeds the permitted use, you will need to obtain permission directly from the copyright holder. To view a copy of this licence, visit http://creativecommons.org/licenses/by-nc-nd/4.0/.
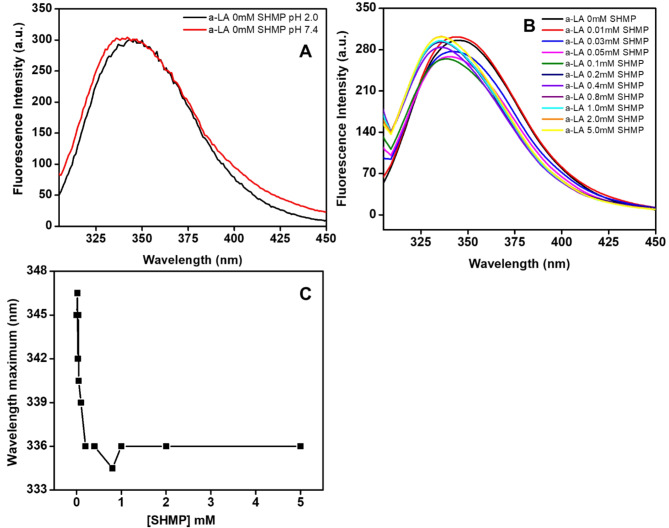
 ), and pH 2.0 (
 ). (B) Intrinsic Trp fluorescence emission spectra (λex = 295 nm) of α-LA (0.2 mg mL−1) without SHMP (
 ), and in the presence of different concentrations of 0.01 (
 ), 0.03 (
 ), 0.05 (
 ), 0.1 (
 ), 0.2 (
 ), 0.4 (
 ), 0.8 (
 ), 1.0 (
 ), 2.0 (
 ), and 5.0 (
 ) mM SHMP at pH 2.0. (C) The wavelength maximum was plotted against SHMP in mM concentration at pH 2.0.
