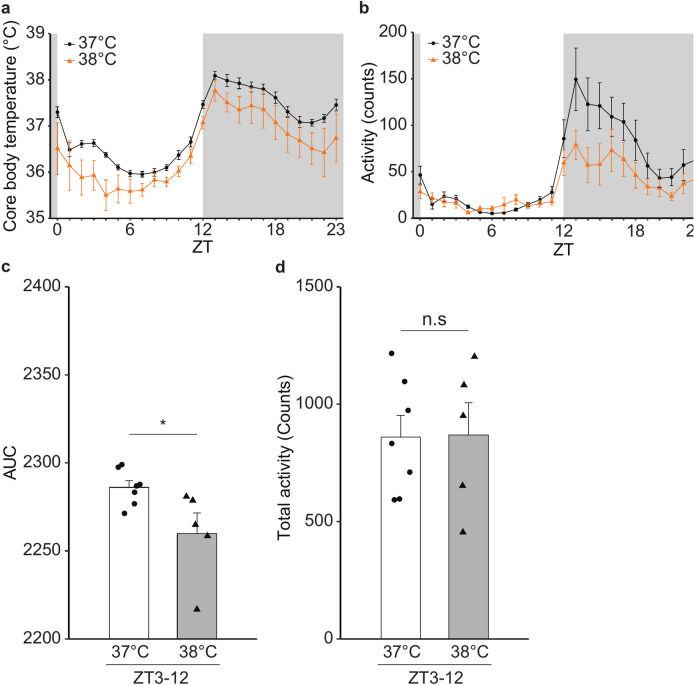
Fig. 2.
Effect of environmental temperature near mouse embryos at the early stage on the Tc of the grown-up male mice. (a, b) Circadian rhythms of core body temperature (a) and activity (b) of the male WT mice (n = 7; 37 °C group, n = 5; 38 °C group). For a given mouse, data were obtained every 1 h for 7 days (see Material and Methods), followed by calculation of a 7-day mean of the data at each time-point. Subsequently, we obtained a mean value (namely, ● and ▲ shown in Fig. 2a and b) at each time-point for a given group. The error bar shows standard error of the mean (SEM). (c) Area under the curve (AUC) of the temperature changes from ZT3 to ZT12. Error bar shows SEM. * p-value < 0.05 (Student’s t-test). (d) Total activity from ZT3 to ZT12. Error bar shows SEM.

