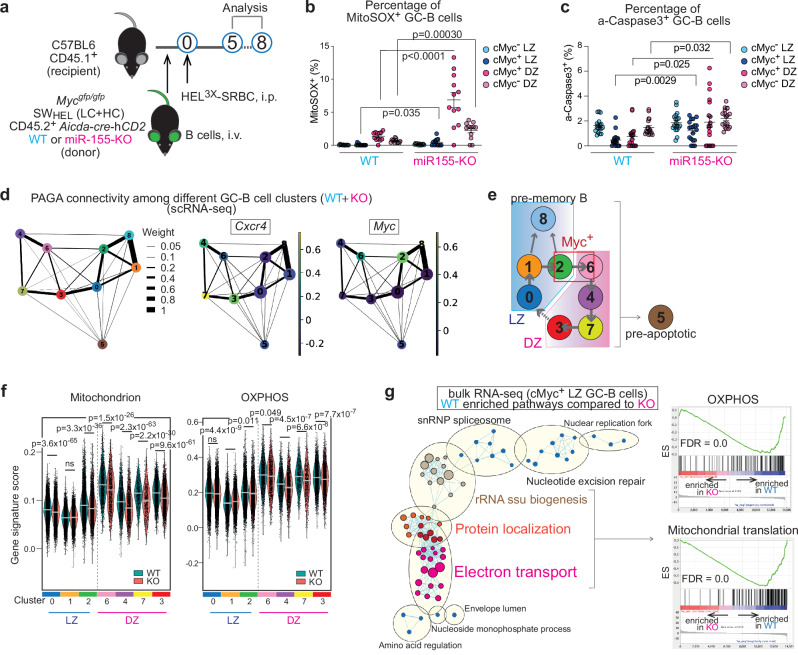
Fig. 1. MiR-155 is required for promoting mitochondrial fitness in GC-B cells.
a Experimental design for all the experiments for Fig. 1. b Percentage of MitoSOX+ GC-B cells five days after HEL3 × -SRBC immunization. Pooled from three independent experiments (WT n = 12; KO n = 12). Unpaired student’s t-test, two-tailed. c Percentage of active-Caspase 3+ GC-B cells at seven days after HEL3 × -SRBC immunization. Pooled from two independent experiments (WT n = 18; KO n = 19). Unpaired student’s t-test, two-tailed. d The PAGA algorithm generates a topology-preserving map of single cells along with the sequential changes of gene expression. PAGA graphs were constructed using a k-nearest neighbors’ algorithm to show relationships between clusters. The Ball-and-stick representation displays PAGA connectivity among GC-B cell clusters identified though scRNA-seq. Ball size represents cluster size, and edge thickness indicates connectivity between clusters. Normalized gene expression for Cxcr4 or Myc is shown in the PAGA graph. e Predicted relationship between the clusters identified in scRNA-seq of GC-B cells. f Violin plots showing gene signature scores for “Mitochondrion” and “OXPHOS”. The bar represents median value. Wilcoxon rank sum test, two-sided, n.s., not significant. g, Enrichment map visualizing GSEA results of the bulk RNA-seq data from WT and KO cMyc+ LZ GC-B cells. GC-B cells were sorted five days after HEL3 × -SRBC immunization. WT-enriched pathways (q < 0.0001) were used. Nodes represent gene sets, and edges represent mutual overlap. Highly redundant gene sets were grouped as clusters (left). ES; enriched score, FDR; false discovery rate. Unless otherwise stated, mean ± SEM is indicated.

