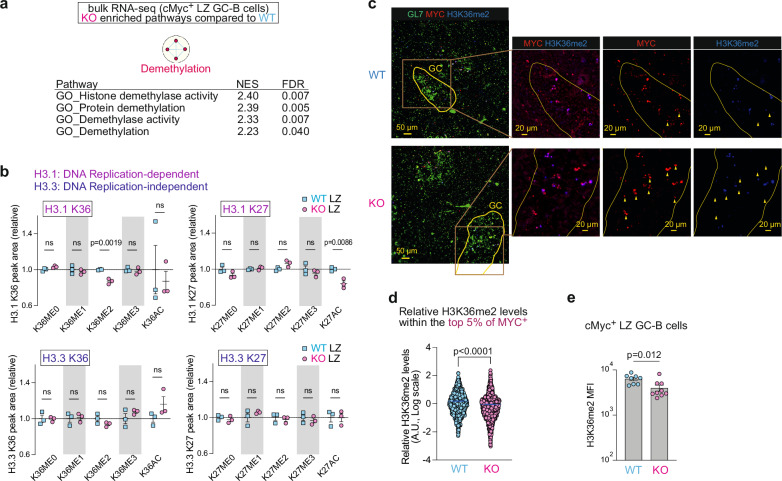
Fig. 2. MiR-155 regulates H3K36me2 levels in dividing LZ GC-B cells.
a Enrichment map visualizing GSEA results of bulk RNA-seq data from WT and KO cMyc+ LZ GC-B cells. KO-enriched pathways (q < 0.1) were used. b The relative abundance of histone PTMs, including histone H3.1 K36, H3.3 K36, H3.1 K27 and H3.3 K27 in LZ GC-B cells from WT and KO mice. Donor-derived GC-B cells were sorted five days after HEL3 × -SRBC immunization for analysis. Triplicate samples were used for both WT and KO backgrounds. Unpaired student’s t-test, two-tailed. c Splenic sections of C57BL/6 mice, in the presence and absence of miR-155, seven days after SRBC immunization were stained for GL7 (green), MYC (red) and H3K36me2 (blue). Yellow wedges represent cells that are positive for MYC but negative for KDM2A. Scale bar, 50 µm. Representative images from two experiments (WT n = 4; KO n = 4). d Relative H3K36me2 levels determined by calculating the ratio of H3K36me2 MI to MYC MI from Supplementary Fig. 2c. The top 5% of MYC intensity values, representing the highest MYC expressing cells, were selected from each batch of two independent experiments. The bar represents mean. Unpaired student’s t-test, two-tailed. A.U., arbitrary unit. e MFI of H3K36me2 in cMyc+ LZ GC-B cells. Pooled from three independent experiments (WT n = 8; KO n = 9). Unpaired student’s t-test, two-tailed. Unless otherwise stated, mean ± SEM is indicated. n.s., not significant.

