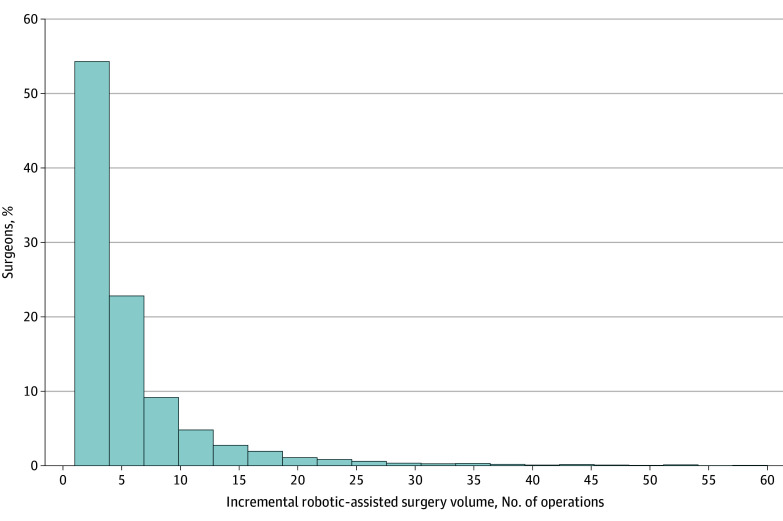
Figure 1. Distribution of Surgeons' Robotic-Assisted Case Volume (2010-2020).
Histogram of the proportion of surgeons performing robotic-assisted hernia repairs grouped by total volume from 2010 to 2020. The x-axis reflects total volume derived from the ratio of hospital total Medicare discharges to total admissions from American Hospital Association data.

