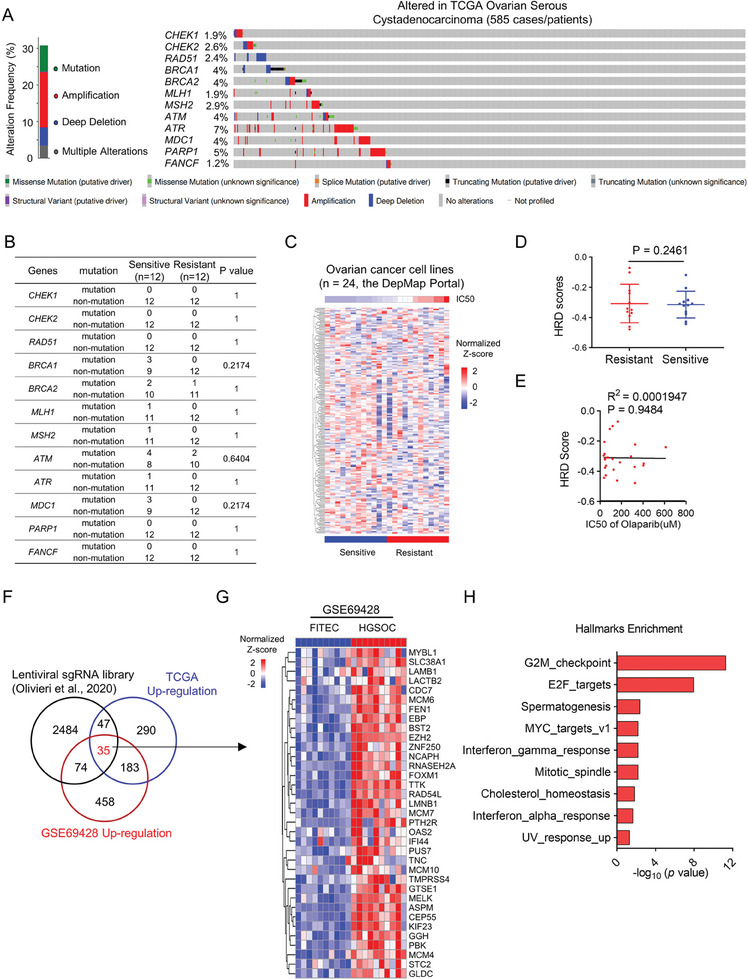
Figure 1.

Olaparib sensitivity is associated with cell cycle dysfunction. A) Genetic alterations including mutations and copy number alterations of DNA damage response genes (CHEK1, CHEK2, RAD51, BRCA1, BRCA2, MLH1, MSH2, ATM, ATR, MDC1, PARP1, FANCF) in TCGA ovarian serous cystadenocarcinoma (n = 585, data were downloaded from cBioPortal, http://www.cbioportal.org). B) Fisher exact test was used for the association between the mutation of DNA damage response genes and Olaparib IC50 of 24 OV cell lines from the GDSC datasets. C,D) Heatmap (C) and HRD scores (D) from unsupervised clustering of HRD gene signatures using transcriptome data of 24 OV cell lines from the DepMap Portal. Data are shown as mean ± SD (two‐tailed t‐test). E) Correlation between HRD scores and IC50 values of 24 OV cell lines from the CCLE database. Statistical correlations were analyzed by the Pearson correlation coefficient. F) Venn diagram showing the overlap of regulators of Olaparib identified by CRISPR screens, genome‐wide transcriptional data from TCGA‐OV (TCGA‐OV transcriptome_U133A‐seq database), and upregulated genes in OV from GEO dataset (GSE69428). G) Heatmap of differentially expressed genes (p < 0.05) in a cohort of HGSOCs (n = 10) compared with matched normal oviduct samples (n = 10) from the GSE69428 dataset. H) The top enriched pathways were shown using the overlapped 35 genes from Figure 1F.
