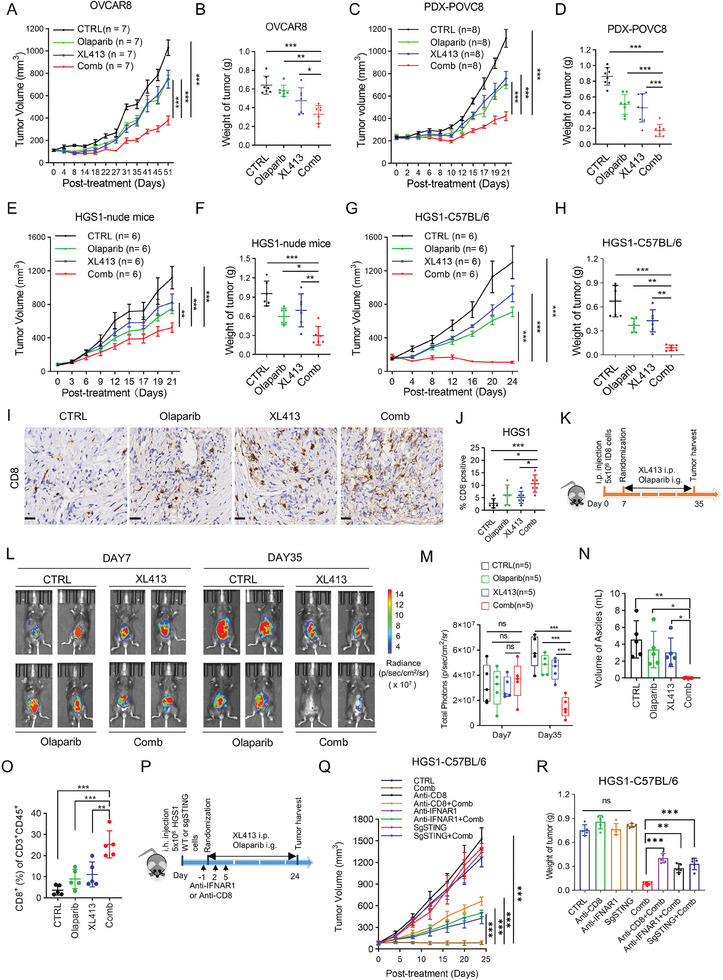
Figure 6.

CDC7 inhibition significantly augments anti‐tumor effect of Olaparib in vivo. A,B) Tumor growth curve (A) and tumor weight (B) of nude mice injected with OVCAR8 cells. Mice were treated with CTRL, Olaparib, XL413, or combination therapy (n = 7). C,D) Tumor growth curve (C) and tumor weight (D) of PDX model (PDX‐POVC8). Mice were treated with CTRL, Olaparib, XL413, or combination therapy (n = 8). E,F) Tumor growth curve (E) and tumor weight (F) of nude mice injected with mouse OV HGS1 cells. Mice were treated with CTRL, Olaparib, XL413, or combination therapy (n = 6). G,H) Tumor growth curve (G) and tumor weight (H) of C57BL/6 mice injected with mouse OV HGS1 cells. Mice were treated with CTRL, Olaparib, XL413, or combination therapy (n = 6). I,J) Representative images (I) and quantifications (J) of CD8 immunohistochemistry in mice bearing HGS1 cells of experiments described in Figure 6G. Scale bar, 25 µm. K–O) C57BL/6 mice were injected intraperitoneally with ID8 cells. Seven days after transplantation, tumor‐bearing mice were randomized into the indicated treatment groups (n = 5). After 4 weeks treatment, mice were euthanized and their tumors were harvested for further analysis. K) Scheme of the experimental design. L) Representative bioluminescence images of mice bearing ID8 cells at day 7 and day 35. M) The bar graph showed the change in bioluminescence in mice. N) Ascites produced in the indicated treatment groups were quantified at the end of treatment. O) Percentages of tumor‐infiltrated CD8+ T cells in the indicated treatment were assessed by flow cytometry analysis. P) Experimental design to evaluate combination effect of XL413 and Olaparib after STING‐KO, blockade of CD8 or IFNAR1 in mice bearing HGS1 cells. Q) Tumor growth curves ± SD from CTRL, XL413 plus Olaparib (Comb), anti‐CD8 alone, Comb + anti‐CD8, sgSTING alone, Comb + sgSTING, anti‐IFNAR1 alone, and Comb + anti‐IFNAR1 treatment groups. R) Tumor weight in HGS1 mice described in Figure 6Q (n = 5). Data in (A,C,E,G,M,Q,R) are shown as mean ± SD (two‐way ANOVA). Data in (B,D,F,H,J,N,O) are shown as mean ± SD (one‐way ANOVA). ns, no significance, * p < 0.05, ** p < 0.01, *** p < 0.001.
