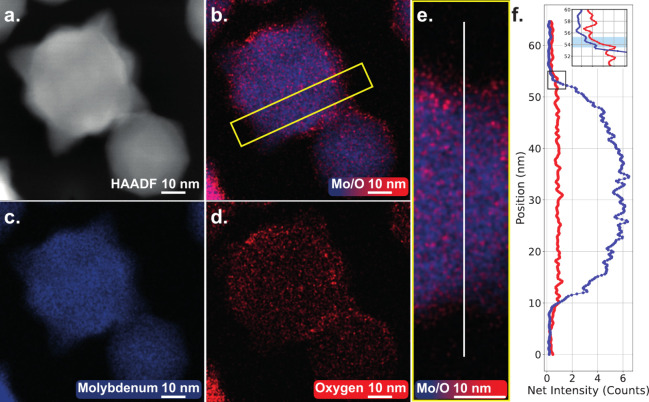
Figure 3.
Energy dispersive X-ray spectroscopy (EDS) of a larger (≈40 nm in diameter) Mo NP with a thin oxide shell (1–2 nm). a. Shows a HAADF-STEM image overview where in b. the STEM-EDS combined color maps reveal the distribution of molybdenum and oxygen. b., c., and d. are color maps based on spectrum imaging; i.e., for each pixel an EDS spectrum is measured. Clear distinctions between respective elemental concentrations can be seen. Paired with e. and f., a sectional line profile, one can see a clear rise of oxygen at the edges of the NP, indicating shell oxidation of approximately 1–2 nm as highlighted in the inset in blue.

