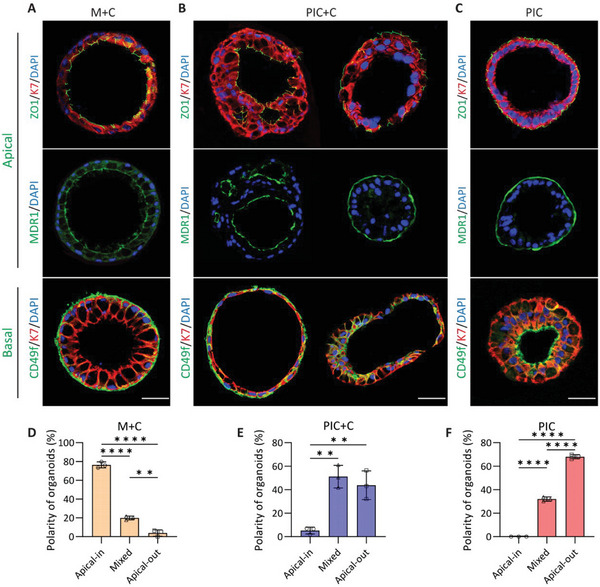
Figure 4.

Immunofluorescence analysis of the cholangiocyte organoids polarity in the three different hydrogels (M+C, Matrigel/collagen I; PIC+C, PIC/collagen I; PIC), and quantified for percentage of apical‐inside, mixed or apical‐out organoids. A) Organoids cultured in M+C hydrogel showed apicobasal polarity (apical side located at the inside of organoid), as indicated by apical markers (ZO1 and MDR1) and the basolateral marker (CD49f / integrin α 6), and quantified 176 organoids for polarity (D). B) Organoids in PIC+C hydrogel showed two kinds of apicobasal polarity, the apical‐out polarization and the normal apical‐in organoid orientation, for which 262 organoids were quantified for polarity (E). C) However, PIC cultured organoid showed apicobasal polarity, opposite to M+C cultures (apical‐inside organoid), for which 161 organoids were quantified for polarity (F). Scale bar = 50 µm, and data are shown as mean ± SD of three independent donors for each group. Statistical differences between the groups were tested using one‐way ANOVA followed by Tukey's test for multiple comparisons; n = 3, **p < 0.01, ****p < 0.0001.
