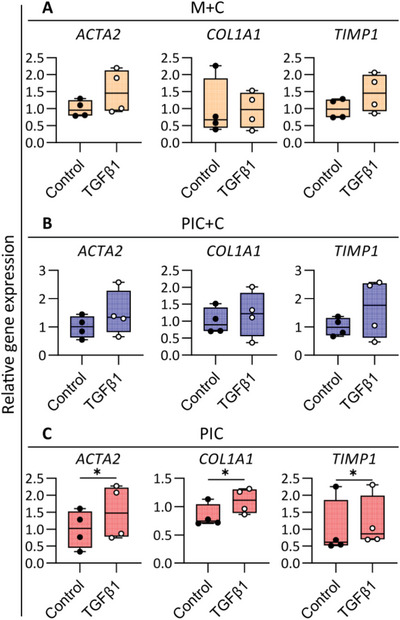
Figure 6.

Modeling pro‐fibrotic responses in cholangiocyte organoids in three different hydrogels (M+C, Matrigel/collagen I; PIC+C, PIC/collagen I; PIC). Gene expression analysis showing the activation of fibrosis related genes ACTA2, extracellular matrix gene COL1A1, and metallopeptidase inhibitor gene TIMP1 in the TGFβ1 treated group versus unstimulated conditions (Control). Data are shown as mean ± SD of four independent donors for each group. Statistical differences between the groups were tested using paired t‐test (one‐tailed); n = 4, * p < 0.05.
