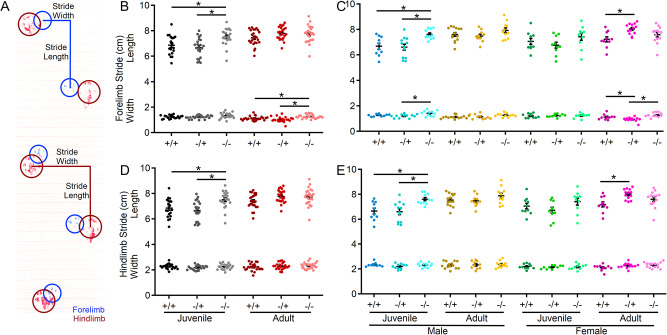
Fig. 4.
Shank3Δex4–22 KO mice develop an elongated stride length as juveniles. (A) Sample gait analysis raw data with location, stride length, and width of the forelimb identified in blue and hindlimb in red. (B-E) Individual (circles) and mean ± SEM (black bars) of the forelimb stride length and width (B, C) and the hindlimb stride length and width (D, E) for each genotype at both ages (B, D) and further separated by sex (C, E). N = 22–25 mice/group for each genotype at each age and N = 10–14 mice/group for each sex within each genotype at each age. *p < 0.05 for post-hoc test between genotypes with a Bonferroni correction

