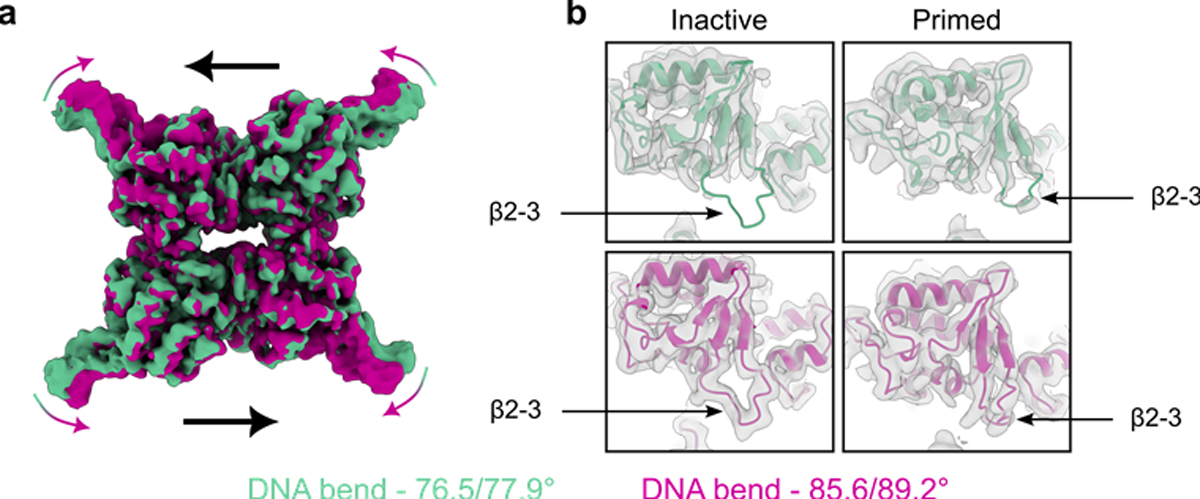
Figure 5. Pre-cleavage dynamics in Tyr-recombinase synaptic complexes.

(a) Overlay of electron density maps from first (green) and last (violet) frames of 3D variability analysis of the CreK201A-loxP pre-cleavage synaptic complex.[45] (b) Models of inactive and active Cre protomers fit to the electron density maps of the CreK201A-loxP complex in a, highlighting the change in density and restructuring of the β2–3 loop region. Panels a and b were adapted from [45].
