Fig. 4.
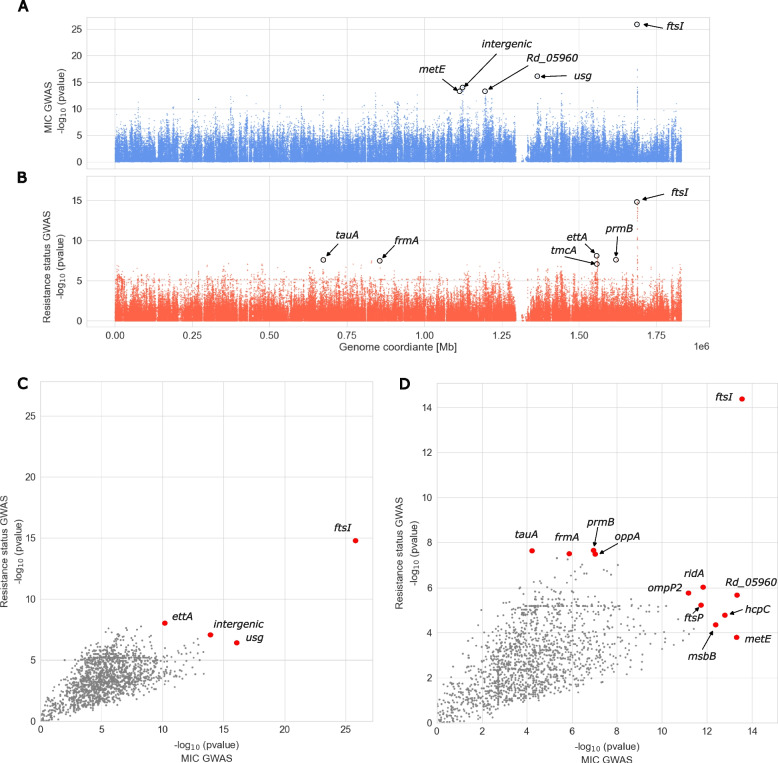
The -1 × log10 transformed p-values of variant associations genome-wide. In panels A and B, each dot represents a variant, in panels C and D, each dot represents a gene. A Manhattan plot of MIC GWAS. B Manhattan plot of resistance status GWAS. C Gene-wise most significant MIC-association p-value (x-axis) versus most significant resistance status-associated p-value (y-axis). Whereas C considers all variants occurring in more than 10 isolates, D considers thereof only the subset of variants causing amino acid substitutions. Only ftsI had in both GWASs a much smaller p-value compared to the remaining genes. Respective HTML-based interactive figures providing detailed information on individual data points at mouse-over are provided as Additional file 3: Material S3 (panel A), 4 (panel B), 5, (panel C), and 6 (panel D)

