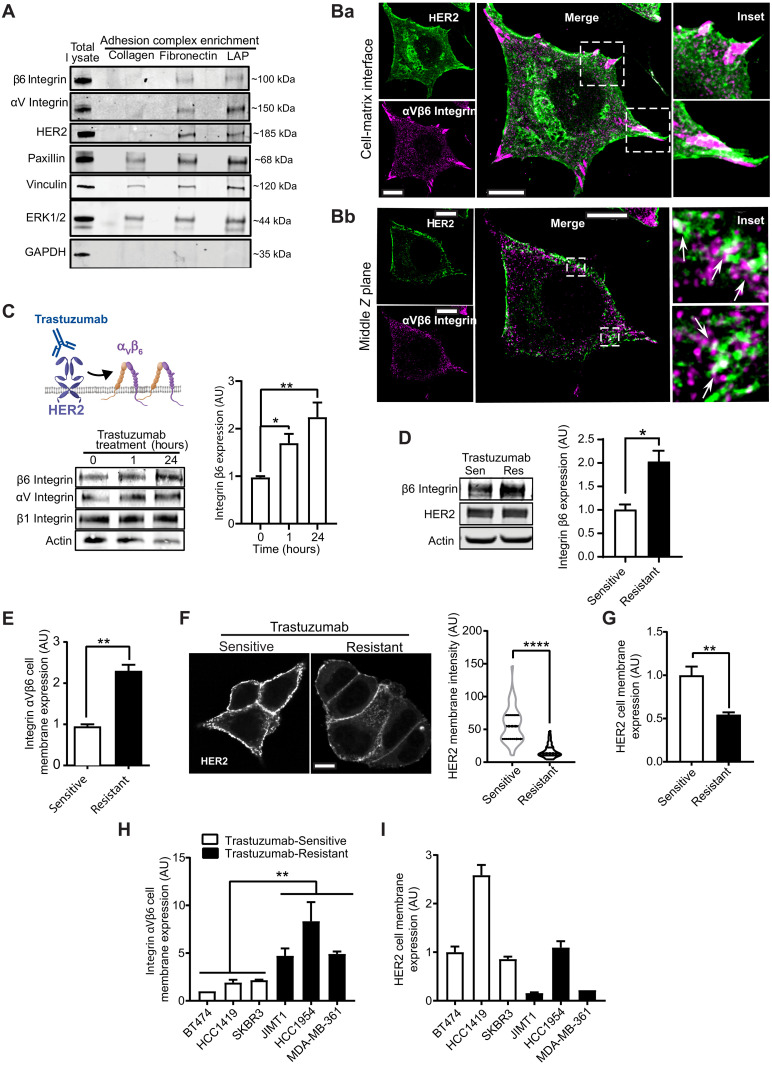
Fig. 2. HER2 and integrin αVβ6 colocalize and trastuzumab regulates HER2 and integrin αVβ6 expression.
(A) Immunoblot analysis of β6 integrin, αV integrin, HER2, paxillin, vinculin, ERK1/2, and GAPDH protein levels in IACs isolated from BT474 cells on LAP, FN, and Coll-I (N = 3). (B) HER2 (magenta) and β6 integrin (green) immunofluorescence in BT474 cells. Two Z planes of the same cell: (Ba) cell-matrix interface and (Bb) middle Z plane. Dashed boxes: insets. Arrows: membrane-proximal vesicular HER2/β6 colocalization; scale bars, 10 μm. (C) Immunoblot analysis of integrin β6, αV, and β1 and actin (loading control) expression in BT474 cells treated with trastuzumab (10 μg/ml) for 0, 1, and 24 hours (N = 3). One-way ANOVA, Šídák’s multiple comparison test. (D) Immunoblot analysis of total β6 integrin and HER2 expression, normalized to actin, in trastuzumab-sensitive (Sen) and trastuzumab-resistant (Res) BT474 cells (N = 3). Two-sided t test, Welch’s correction. (E) Flow cytometry analysis of cell surface αVβ6 integrin expression in trastuzumab-sensitive and trastuzumab-resistant BT474 cells [mean fluorescence intensity (MFI) normalized to Sen cells, N = 4]. Two-sided t test. (F) Fluorescence analysis of HER2 expression at the plasma membrane of trastuzumab-sensitive and trastuzumab-resistant nonpermeabilized BT474 cells surface labeled with FITC-conjugated HER2 affibody (N = 3; 44 to 52 cells per condition); scale bar, 10 μm. Two-sided Mann-Whitney test. (G) Flow cytometry analysis of HER2 cell surface expression in trastuzumab-sensitive (Sen) and trastuzumab-resistant (Res) BT474 cells (MFI normalized to Sen cells, N = 3). Two-sided t test. (H and I) Cell surface expression of αVβ6 integrin (H) and HER2 (I) by flow cytometry in HER2+ breast cancer cells that are endogenously sensitive (white) or resistant (black) to trastuzumab (N = 4). One-way ANOVA, Dunnett’s multiple comparison test. [(C) to (I)] Data shown are arbitrary units (AU) normalized to control means (untreated trastuzumab-sensitive BT474 cells) ± SEM. Statistical significance: *P < 0.05; **P < 0.01; ****P < 0.0001.

