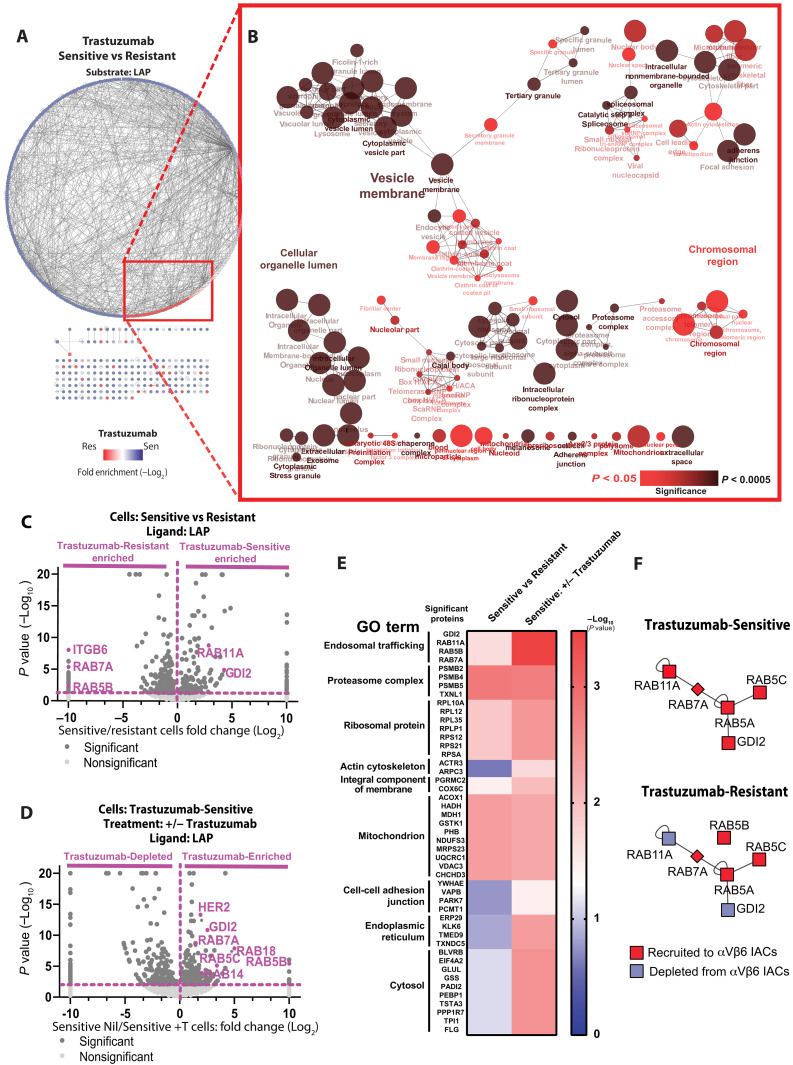
Fig. 3. RAB5/RAB7A/GDI2 trafficking subnetwork is differentially recruited to αVβ6 IACs in HER2+ breast cancer cells by trastuzumab.
IAC enrichment coupled with free-label MS was used to define proteins specifically recruited to ligand-bound αVβ6 in BT474 cells. (A) Protein-protein interaction network of proteins significantly enriched in αVβ6-mediated complexes of trastuzumab-sensitive (blue nodes) and trastuzumab-resistant cells (red nodes). Lines (edges) linking nodes represent protein-protein interactions. (B) Visual representation of ClueGO cellular compartment GO analyses of proteins significantly enriched in αVβ6-mediated complexes of trastuzumab-resistant cells in comparison with trastuzumab-sensitive cells. Node size represents the number of mapped proteins in each GO term, color indicates the level of significance of each GO term, and node clustering and edge length represent functionally grouped networks based on kappa score. See also fig. S6 (C and D) [BT474 Trastuzumab-Sensitive +/− trastuzumab (10 μg/ml)]. (C and D) Volcano plots demonstrating enrichment of proteins identified on LAP in (C) BT474 Trastuzumab-Sensitive cells (right) versus BT474 Trastuzumab-Resistant cells (left) and (D) BT474 Trastuzumab-Sensitive cells following 96 hours pretreatment with sublethal concentration of trastuzumab (10 μg/ml) or vehicle control. Statistical analysis: Fisher’s exact test; quantitative method: weighted spectra; significance level: P < 0.05. Significant proteins (dark gray); nonsignificant proteins (light gray); proteins of interest highlighted in purple. (E) Heatmap displaying statistical significance (−log10 P values) of the best hit protein per group, clustered by their main GO terms. Data obtained from analysis displayed in (C) and (D). (F) Schematic representation of differential enrichment of trafficking regulatory subnetwork components in trastuzumab-sensitive and trastuzumab-resistant BT474 cells. Proteins recruited to, or depleted from, αVβ6 IACs are shown in red and blue, respectively. All MS data represent three independent experiments. See also fig. S6 (C and D) and data file S3.

