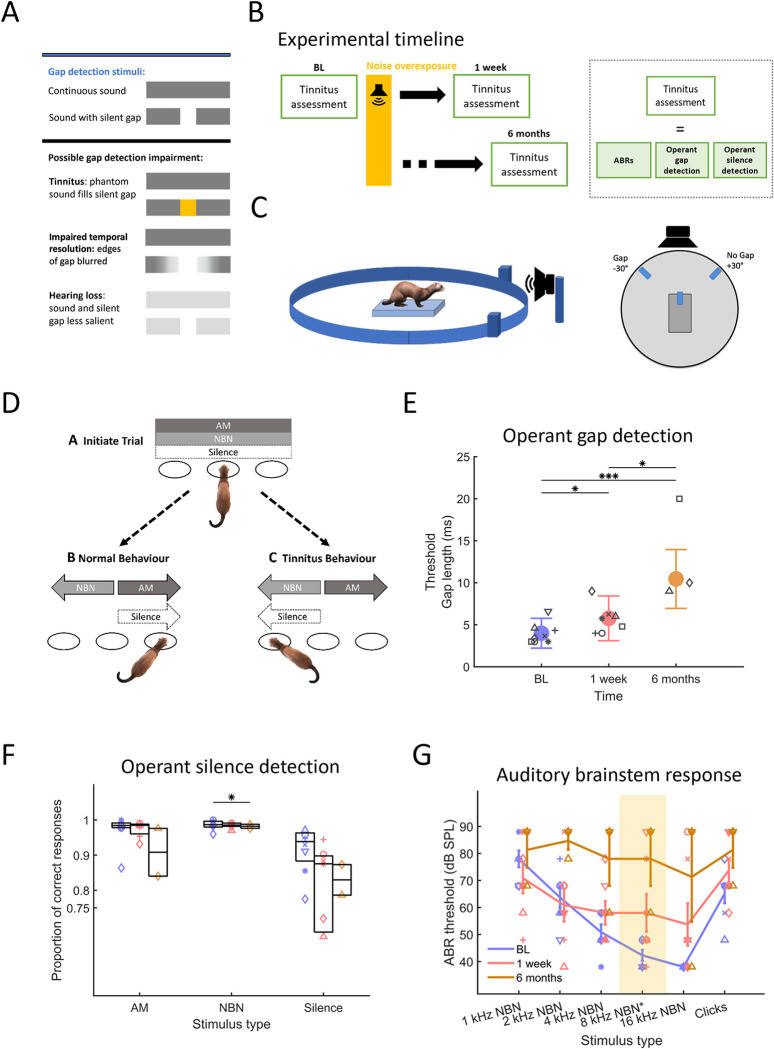
Fig 1. Behaviour and auditory brainstem responses are impaired after noise overexposure.
(A) Stimuli used in gap-in-noise detection paradigms. Different hypotheses on how silence gap detection could be affected by tinnitus filling the gap, degradation of temporal resolution that would blur the edges of the gap and by hearing loss reducing the silent gap saliency. (B) Experimental timeline. Animals were assessed in behavioural paradigms (operant silent gap detection, silence detection), and auditory brainstem responses (ABRs) were obtained. Assessments of all these metrics took place once under baseline conditions and on two occasions after noise overexposure (NOE), starting one week after NOE and within two months and six months following NOE. ABRs were always tested on one day in the first week following NOE and again 6 months later, whereas it took two months to complete behavioural testing at each of the three time points. (C) Operant gap detection setup. Behavioural arena with a central platform from which the animal initiates a trial, loudspeaker located at 0° azimuth relative to the centre platform and water spouts at +30° and -30°. (D) Silence detection paradigm. The task took place in the same arena as shown in C. Animals were trained to activate the +30° sensor for AM and silence trials and the -30° sensor for NBN trials. An animal experiencing tinnitus is expected to mistake silence trials for NBN trials and respond accordingly (behavioural task modified from [55]). (E) Operant gap detection. Gap detection thresholds before NOE (BL), 1 week after (1 week) and 6 months after (6 months). Error bars represent standard deviation (SD). Symbols represent individual animals (n = 8 baseline, n = 7 one week, n = 3 six months). Colour coding in each panel and in subsequent figures: Blue for baseline, red for one week, and orange for six months following noise overexposure. (F) Operant silence detection. Proportion of correct trials for AM, NBN and silence trials. Error bars represent box plot interquartile ranges across sessions. Asterisk represents statistical significance at p<0.05 between proportion of correct responses at baseline and at six months following noise overexposure. (G) Auditory brainstem response (ABR) thresholds, defined as the lowest intensity where a significant response–local peaks of waves 1–4 –could be observed by a trained experimenter under blind conditions. Markers in panels E, F, G represent the mean values from individual animals. Asterisks for panels E and F represent p values *<0.05, **<0.01, ***<0.001. Experimental timepoints are depicted in blue (BL), red (1 week), orange (6 months).

