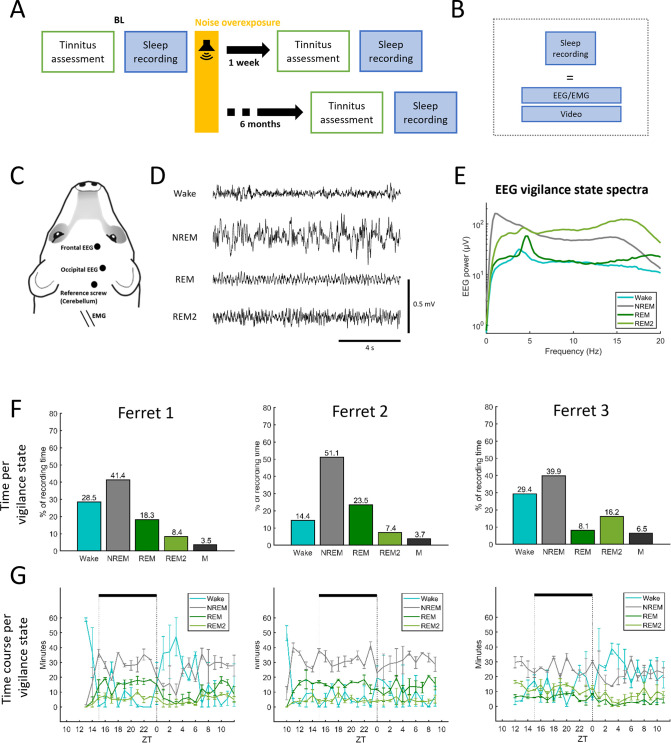
Fig 2. Chronic recordings during sleep and wakefulness.
(A) Experimental timeline for implanted animals. Three ferrets were assessed for tinnitus, hearing loss, EEG brain activity and sleep-wake behaviour before and after noise overexposure (NOE). Assessments of all these metrics took place once under baseline conditions (BL) and on two occasions after NOE, the first assessment (One week) commencing one week following NOE and the second starting six months following NOE. In addition to the ‘tinnitus assessment’, (Fig 1), brain activity was recorded (based on frontal and occipital EEG) in the freely behaving animals for approximately 48 hours in each condition. (B) Sleep recording consists of EEG/EMG and continuous video recording. (C) Depiction of the ferret head showing the position of the implanted screw electrodes for EEG recordings (frontal and occipital), the ground reference electrode implanted over the cerebellum and the EMG wire electrodes on a schematic ferret head. (D) Example EEG traces during wakefulness (Wake), non-rapid eye movement sleep (NREM), rapid eye movement sleep (REM) and REM2 sleep (REM2). EEG signals displayed in this panel are band-pass filtered (0.5–30 Hz) and were obtained under baseline conditions (before NOE). (E) EEG vigilance state spectra in the ferret (example based on Ferret 3). Data are means across EEG spectra of the frontal derivation calculated for two consecutive 24 hour recordings, based on 0.25 Hz frequency bins. Shading depicts the standard error. Vigilance states (Wake, NREM, REM and REM2) are colour-coded (see inset figure legend). (F) Amount of wakefulness and sleep under baseline conditions for each ferret. M, movement artefacts within sleep episodes. (G) Time course of wakefulness and sleep under baseline conditions for each ferret. Zeitgeber time (ZT) represent the start of light period.

