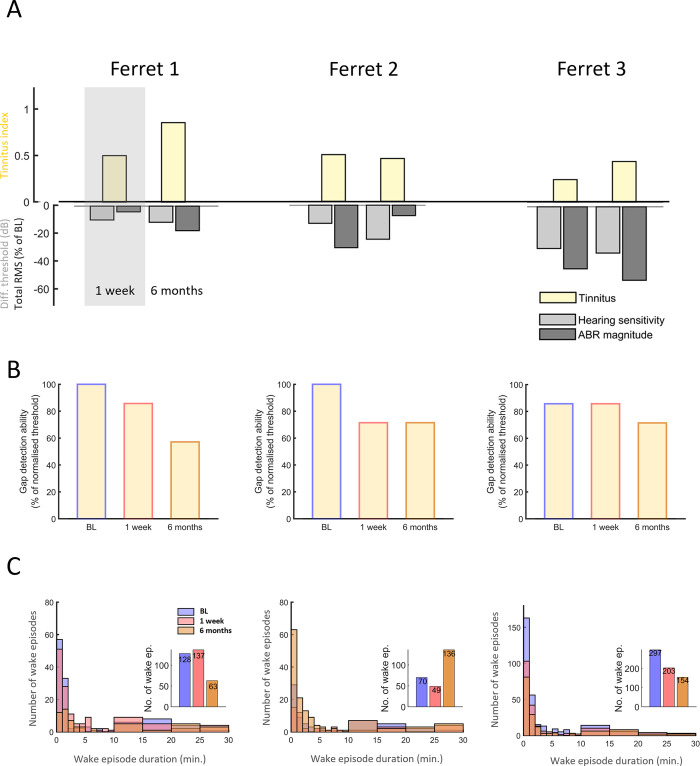
Fig 3. Tinnitus development, hearing loss and sleep disruptions assessed over time.
(A) Tinnitus and hearing loss development over time in the three implanted ferrets (Ferrets 1–3). Yellow bars depict behavioural evidence for tinnitus (using the tinnitus index, TI, for each animal (based on operant gap and silence detection; see Methods for details)). Light grey bars show hearing loss based on the differences from baseline in ABR thresholds while dark grey bars show the change in ABR total RMS magnitude, respectively. The bars are a depiction of the metrics for TI and ABR changes displayed in S3 Fig. The size of each bar indicates the change relative to BL of the corresponding measure at 1 week and 6 months. Each panel represents a different ferret. Left to right: Ferret 1, Ferret 2, Ferret 3. (B) Impairment in gap detection ability over time based on thresholds. Displayed values correspond to the m(thresh) metric used to calculate the tinnitus index (TI, see panel A) for each individual case. Values are based on gap detection thresholds fitted on a continuous scale ranging from 0–100%. 100% corresponds to a gap detection threshold of 3ms, and the remaining gap lengths (5, 10, 20, 50, 270ms) correspond to the evenly spaced decrements in threshold (see methods for details). Note that an increase in gap detection threshold over time is represented by a decrease in the values presented here. Blue framed bars are Baseline test (BL); red and orange framed bars correspond respectively to measurements conducted at 1 week and 6 months post noise exposure (C) Number of wake episodes during ~ 48 hours of baseline recording. Large panels are histograms depicting the number of wake episodes separated by episode duration and the insets are the total number of wake episodes for baseline (BL), one week and 6 months. The y-axis and the number displayed in the bars in the inset panels depict the number of wake episodes. Note the difference in y-axis scale for ferret 3. Panels left to right: Ferret 1, Ferret 2, Ferret 3. Note that in Ferret 2 the number of wake episodes of nearly all durations increase six months following NOE and overlap the other bars (Baseline and one week post NOE) in the panel. Experimental timepoints are depicted in blue (BL), red (1 week), orange (6 months).

