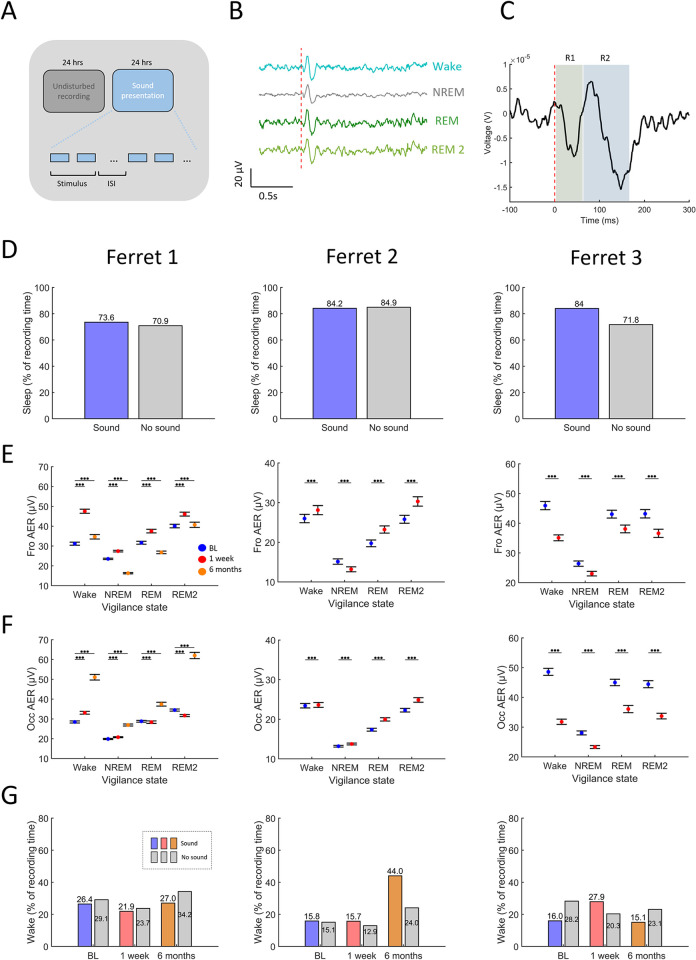
Fig 4. Sound evoked cortical activity across vigilance states before and after NOE.
(A) Experimental paradigm. Sounds were presented through a single loudspeaker located at the top of the enclosure over a period of 24 hours subsequent to 24 hours of undisturbed recordings. Sounds were one octave narrow band noise (NBN) bursts centred at 1, 4, 8, and 16 kHz, at a stimulus level of 40, 50, 60, and 65 dB SPL, with a duration of 820 ms that included a silent gap of 38 ms. Stimuli were randomly presented with an interstimulus intervals of 10–42 seconds for a total number of 200 presentations per stimulus-level combination. (B) Average EEG evoked responses during Wake, NREM, REM and REM2 sleep during the baseline condition. Signals are averages for one animal (Ferret 3) during the baseline condition. (C) Definition of evoked response magnitude. Evoked responses recorded from each animal were partitioned into components defined by the number of peaks and troughs in the signal. Evoked response magnitude was defined as the difference between the peak and subsequent trough for each response component (R1 and R2 in this example, see S6 Fig for Ferrets 1–3). (D) Sleep durations (as percent of recording time) in undisturbed conditions and with sound presentation measured in basal conditions before NOE. Each panel depicts one ferret. Panels left to right: Ferret 1, Ferret 2, Ferret 3. (E) Frontal EEG auditory evoked response (AER) across vigilance states before and after NOE (colour coded). Data are averages across response components, sound level and stimulus type based on bootstrap means ± standard errors (See methods). (F) Depiction as in E but for occipital EEG configuration. Asterisks for panels E-F represent statistical significance p values *<0.05, **<0.01, ***<0.001 (GLMM). Each panel depicts one ferret. Panels left to right: Ferret 1, Ferret 2, Ferret 3). Due to decreased signal quality in the six months post NOE assessment in Ferrets 2 and 3, AERs could not be quantitatively assessed for these timepoints. (G) Amount of wakefulness in baseline (BL), one week and 6 months post NOE recordings with sound presentation (coloured bars) and without sound presentation (grey bars), depicted as percent of recording time. Each panel depicts one ferret. Panels left to right: Ferret 1, Ferret 2, Ferret 3. Experimental timepoints are depicted in blue (BL), red (1 week), orange (6 months).

