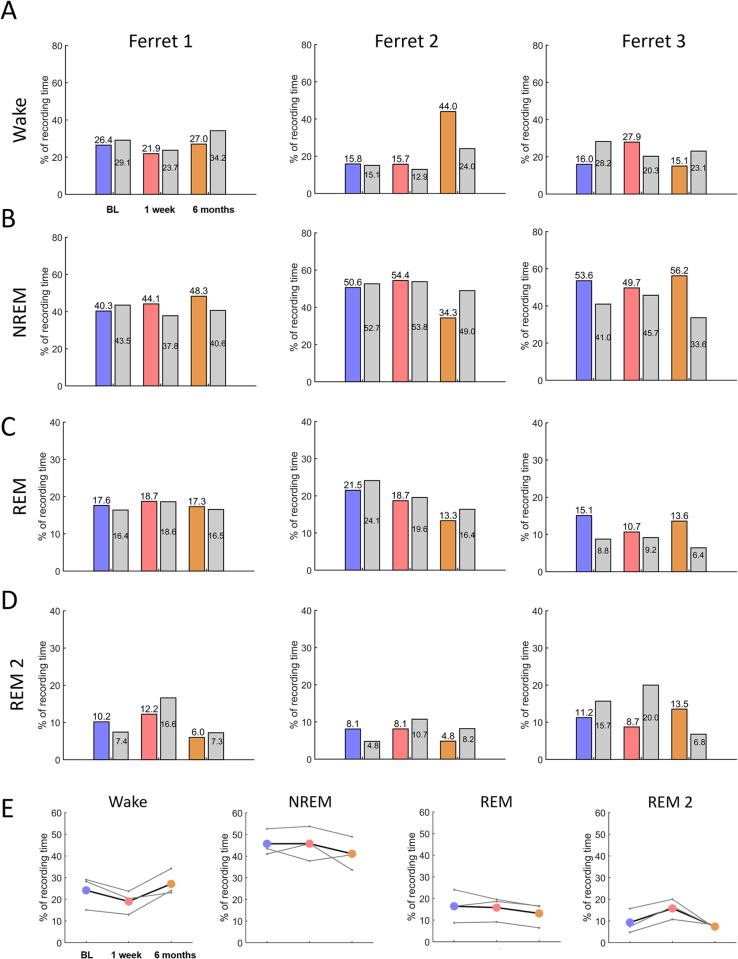
Fig 5. Vigilance state durations with and without sound presentation.
(A-D) In each panel, colour bars show amount of time spent in wake, in NREM, in REM and in REM2 sleep, respectively, during 24 hrs of recording with sound presentation before noise overexposure (BL, baseline, blue), starting one week following NOE (red), and six months following NOE (orange). Grey bars show amount of time spent in the respective states without sound presentation. Numbers in the bar plots represent time spent in the corresponding state as a percentage of recording time. Each column of panels represents data from one animal (left to right: Ferret 1, Ferret 2, Ferret 3). (E) Average vigilance state amounts during baseline (BL), one week and six months following NOE without sound presentation. Coloured markers and black lines depict averages and thin lines individual animal values.

