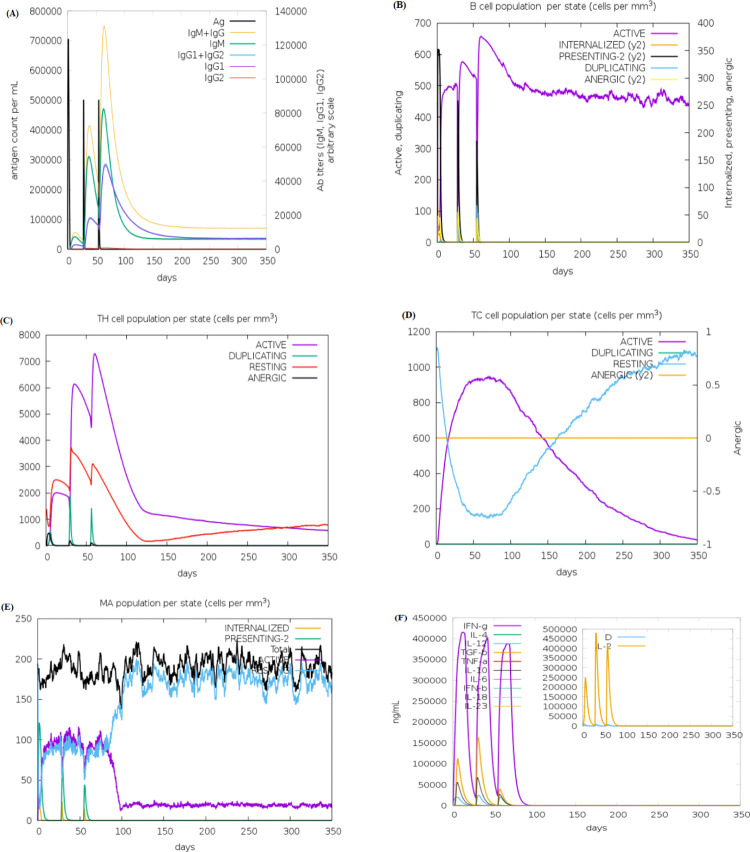
Fig 6.
In silico immune simulation of vaccine HPeV-Vax-2 includes the following components- (A) Antibodies generated in response to antigen injections were depicted as various colored peaks, while the antigen itself was represented in black (B) B cell population (C,D) Active T-helper (TH) cell population and Active T-cytotoxic (TC) cell populations. The resting state indicated cells that had not been exposed to the antigen (vaccine). In contrast, the anergic state showed T-cells’ tolerance to the antigen as a result of repeated exposures. (E) Macrophage population; (F) The secretion of induced cytokines and the diversity measurement of IL-2 levels.

