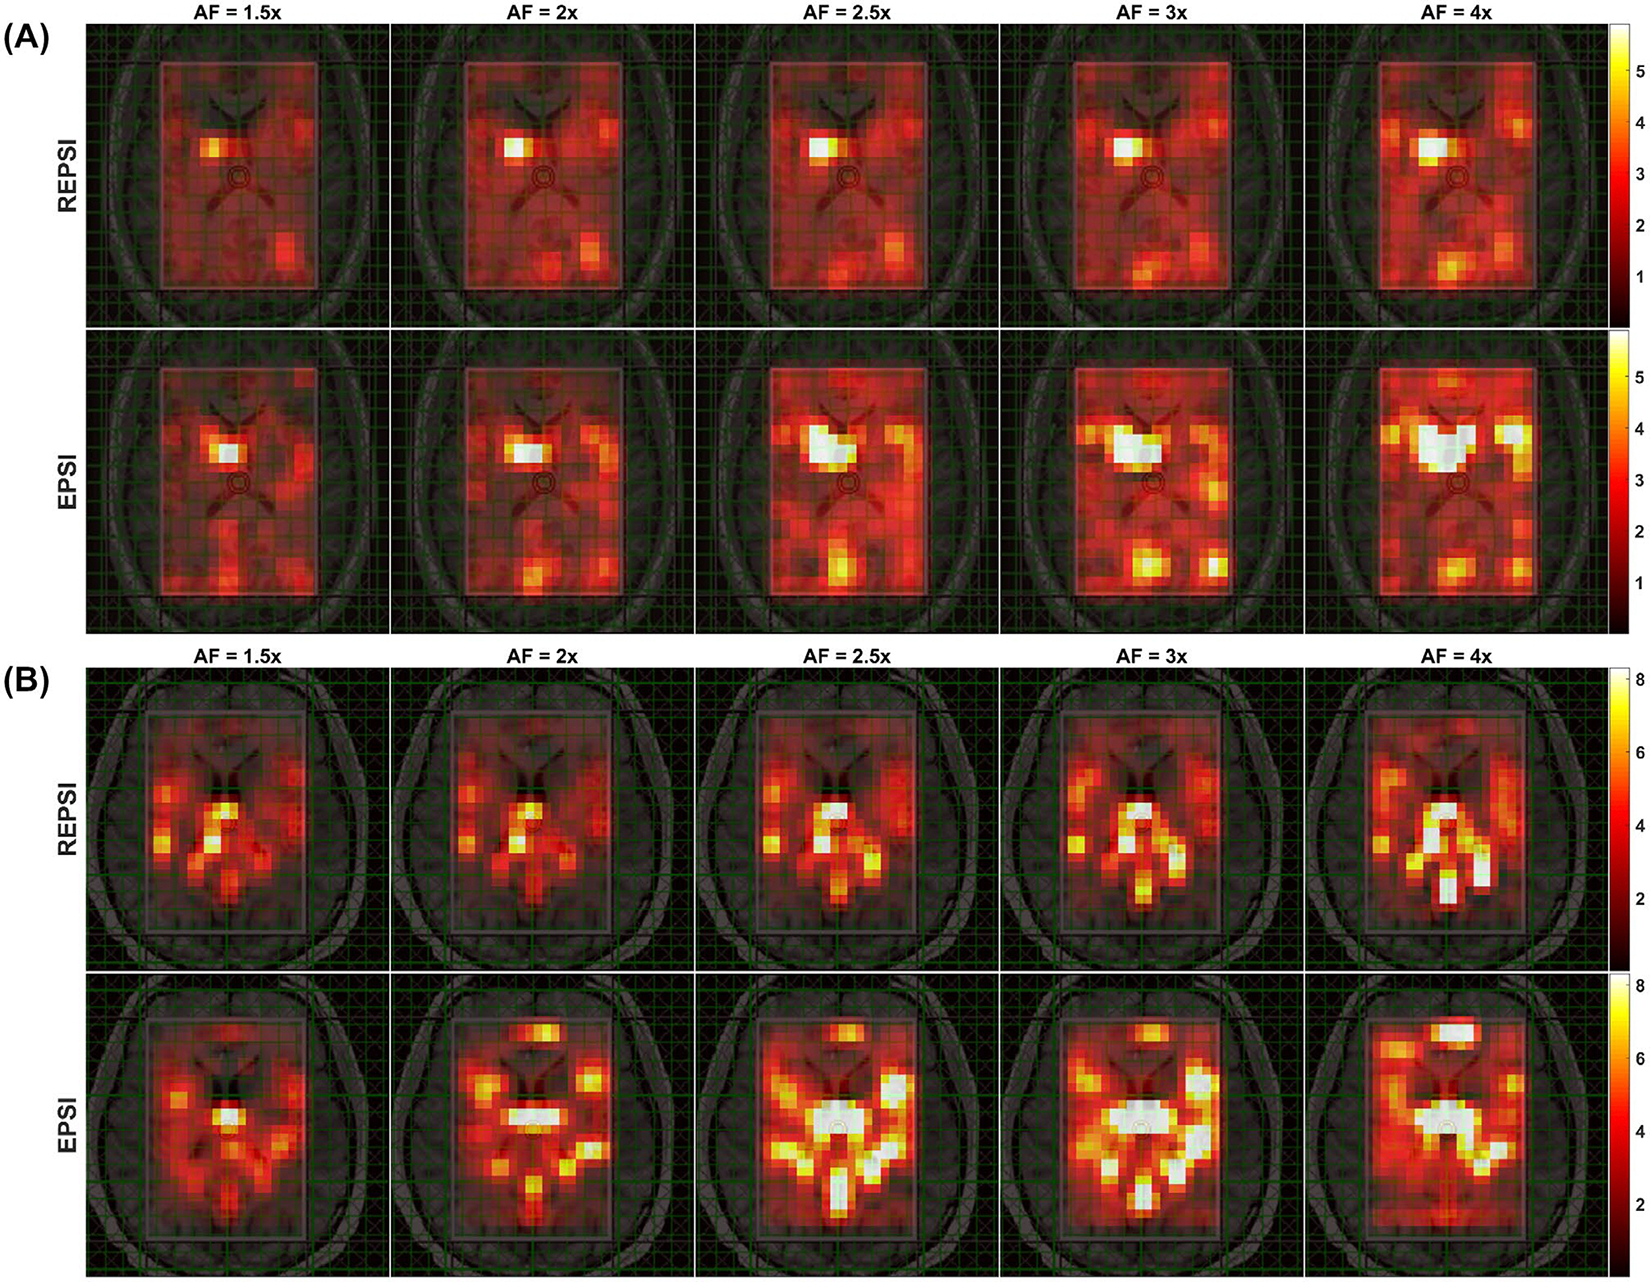
FIGURE 3.

A, Maps of the spectral normalized RMS error (nRMSE) computed from CS reconstructions of retrospectively undersampled REPSI and EPSI in vivo data from a 26-year-old healthy volunteer, shown for AFs corresponding to 21 (1.5×), 16 (2×), 13 (2.5×), 11 (3×), and 8 (4×) radial spokes or -lines. B, Spectral nRMSE maps from CS reconstructions of retrospectively undersampled REPSI and EPSI in vivo brain data acquired from a healthy 33-year-old male volunteer, shown for AFs of 1.5, 2, 2.5, 3, and 4. All maps are interpolated by a factor of two
