. 2024 Dec 4;13:RP96933. doi: 10.7554/eLife.96933

Figure 9. Deletion of REV7 increases the frequency of mitotic homologous recombination (HR).

(A) Schematic representation of plasmid-chromosome recombination assay. The ura3-1 and ura3-G4 alleles are located on chromosome V and plasmid pFAT10-G4, respectively. Recombination between a plasmid borne ura3-G4 allele and the chromosomal borne ura3-1 allele would result in Ura+ prototrophs. (B) Representative images of Ura3+ papillae on SC/-Ura agar plates in the absence or presence of 100 mM HU. (C) Quantification of the rate of HR frequency in different strains. Data are presented as mean ± SD from three different experiments. ns, not significant, **p < 0.01, ***p < 0.001, ****p < 0.0001 versus control, as assessed using one-way ANOVA and Tukey’s post hoc test.

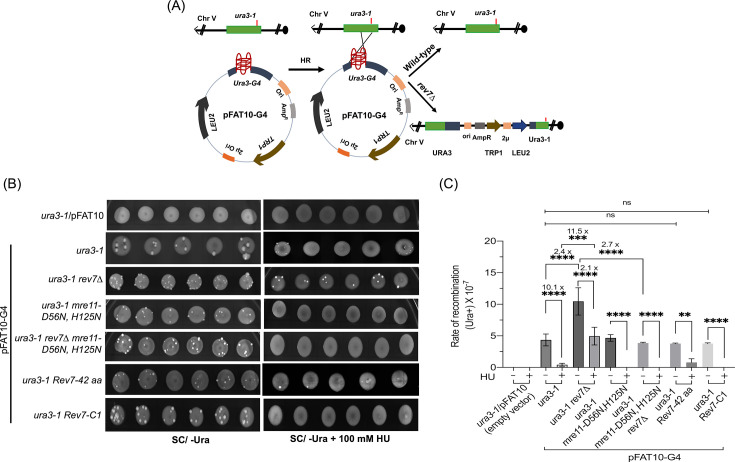
Figure 9.

Figure 9—figure supplement 1. Mutation of G-quadruplex-forming motifs markedly attenuate the rate of homologous recombination (HR) frequency in rev7Δcells.

Figure 9—figure supplement 1.

(A) Representative images showing Ura3+ papillae on SC/-Ura agar plates in the absence or presence of 100 mM HU. Cells were imaged after 6 days of growth at 30°C. (B) Quantification of the rate of HR frequency in ura3-1 and ura3-1 rev7Δ strains carrying plasmids with unmutated and mutated ura3-G4 inserts in the absence of HU. Data are presented as mean ± SD from three different experiments. n.s., not significant, *p < 0.05, and ***p < 0.001 versus control, as assessed using two-way ANOVA and Sidaks multiple comparison test.
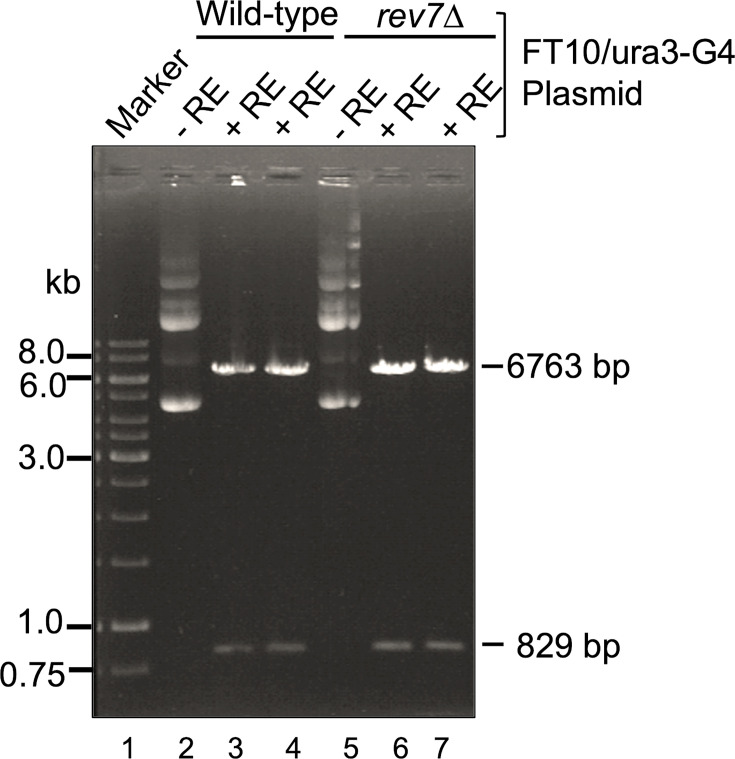
Figure 9—figure supplement 2. G-quadruplex-forming motifs are stable in rev7Δ cells during the homologous recombination (HR) assay.

Figure 9—figure supplement 2.

Total plasmid pFAT10-G4 DNA was isolated from cultures of wild-type (WT) and rev7∆ cells. Samples of undigested and BamHI and Sph1 digested plasmid pFAT10-G4 DNA were analyzed by electrophoresis on a 0.6% agarose gel and visualized after staining with ethidium bromide. Lane1: DNA marker; lanes 2 and 5, represent undigested plasmid DNA from the WT and rev7∆ cells, respectively. Lanes 3 and 4, plasmid pFAT10-G4 DNA from the WT cells digested by BamHI and Sph1; lanes 6 and 7, same as lanes 3 and 5, but plasmid isolated from rev7∆ cells. +RE and −RE indicate DNA digested by BamHI and Sph1 and undigested plasmid DNA, respectively.
Figure 9—figure supplement 2—source data 1. Original file and labeled PDF file for the gel image displayed in Figure 9—figure supplement 2.
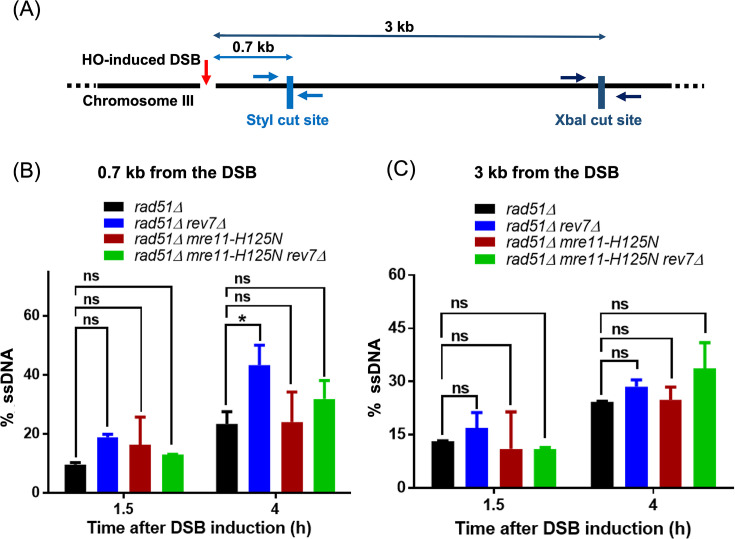
Figure 9—figure supplement 3. Deletion of Rev7 enhances the speed of short-range end-resection in S. cerevisiae.

Figure 9—figure supplement 3.

(A) Schematic diagram represents the positions of StyI (0.7 kb) and XbaI (3 kb) restriction sites with respect to HO endonuclease-induced double-strand break (DSB) at the Chromosome III MAT locus. Arrows flanking the restriction sites mark the binding sites of forward and reverse primers used for qPCR analysis. The 5'—3' end-resection was physically assessed in the indicated strains by quantifying the percentage of ssDNA generated at 1.5 and 4 hr post induction of DSB, at a distance of (B) 0.7 kb and (C) 3 kb from the DSB. Two-way ANOVA was performed to determine the statistical significance of the datasets and graphs were generated using GraphPad Prism (Version 5.0). Data are representative of two independent biological replicates. ns, not significant; * p < 0.05.