FIGURE 3:
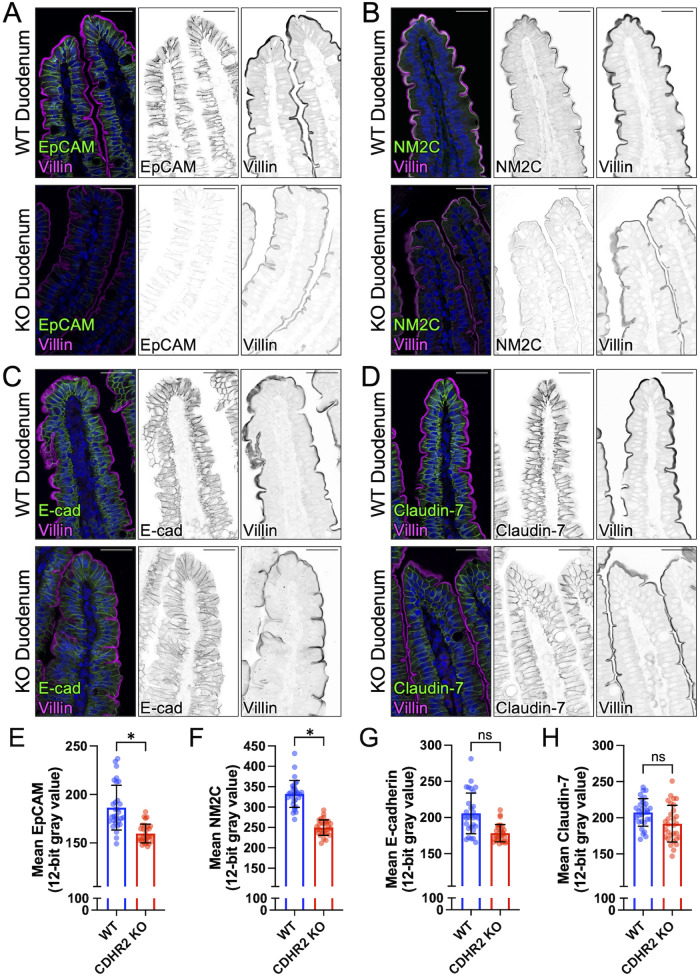
CDHR2 KO mouse duodenum exhibits reduced levels of some junctional components. Confocal images of wildtype (WT) and CDHR2 KO duodenal sections stained for villin (magenta) and the following markers in green: (A) EpCAM, (B) NM2C, (C) E-cadherin, and (D) Claudin-7. Mean intensities (12-bit gray values) measured for (E) EpCAM, (F) NM2C, (G) E-cadherin, and (H) Claudin-7. Nuclei are marked by DRAQ5 (blue). Intensity measurements for each marker were derived from two WT and CDHR2 KO littermate pairs and 15 image fields at 40X were analyzed from each animal. For plots in E–H, points represent individual 40X image fields with mean ± SD. Significance levels from unpaired t tests calculated for experimental replicates are shown above each plot (*p < 0.05). Break in Y axes represents level of background fluorescence. Scale bars: 40 µm (A–D).

