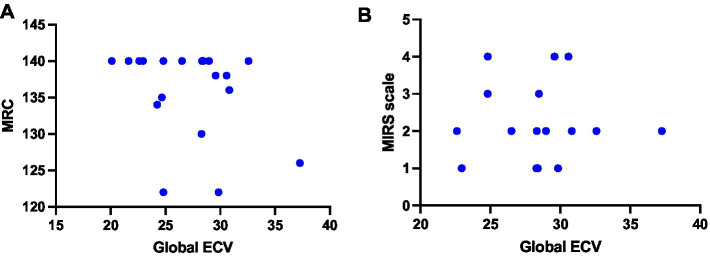
Figure 4.
Relationship between ECV values and neuromuscular status of DM1 patients. (A) Correlation between global ECV and total MRC scores (Spearman r test; ρ = −0.2938, p = 0.2087) (B) Correlation between global ECV and MIRS scale values (Spearman r test; ρ = −0.2938, p = 0.2087). ECV, extracellular volume; MIRS, myotonia impairment rating scale; MRC, medical research council.

