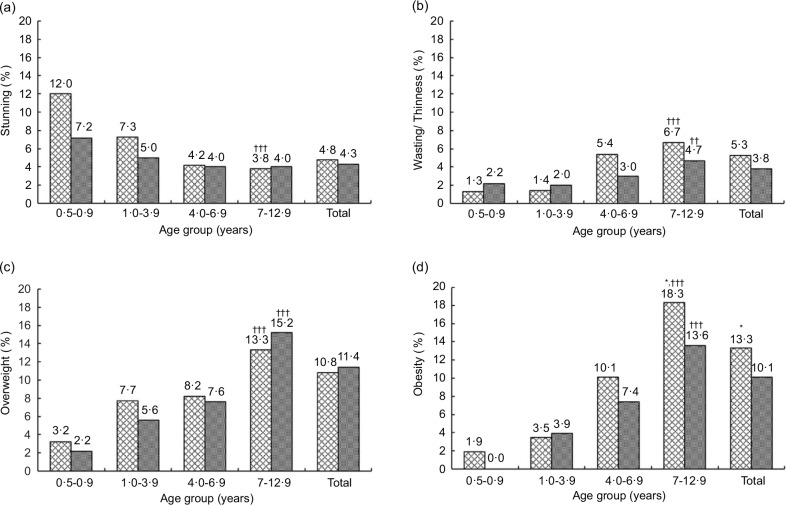
Fig. 2.
Weighted prevalence of (a) stunting, (b) wasting/thinness, (c) overweight and (d) obesity by age group and sex. *P < 0·05: significant difference between boys ( ) and girls (
 ) based on complex samples Pearson Chi-Square. ††P < 0·01, †††P < 0·001: significance of trend of nutritional status with age group in each sex. Stunting: height-for-age z-scores <–2 sd; wasting/thinness: wasting and thinness combined; wasting (<5 years): weight-for-height z-scores <–2 sd; thinness (5–12 years): BMI-for-age z-scores <–2 sd; overweight: BMI-for-age z-scores >2 to ≤3 sd (<5 years) and >1 to ≤2 sd (5–12 years); (d) obesity: BMI-for-age z-scores >3 sd (<5 years) and >2 sd (5–12 years)

