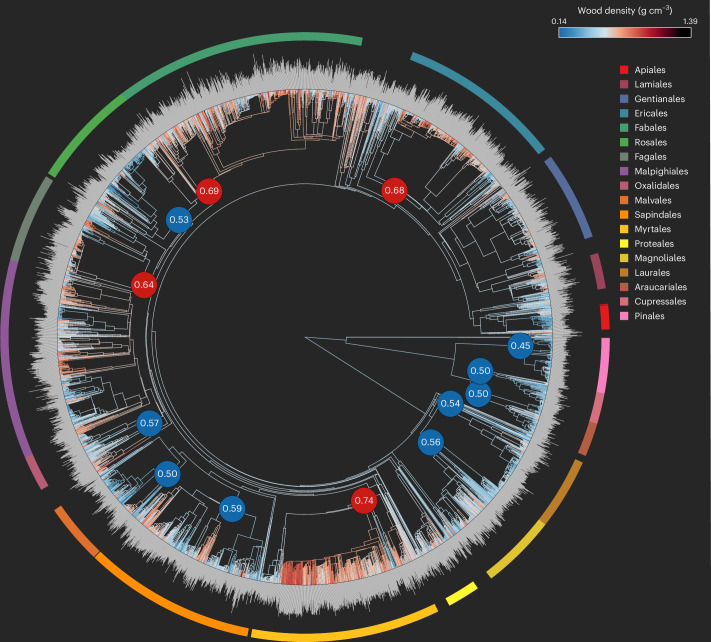
Fig. 2. Phylogenetic tree and wood density information of global tree species.
The phylogenetic tree was constructed using the R package V.PhyloMaker, with wood density information available for 4,298 species (189 families from 55 orders). Wood density exhibits a strong phylogenetic signal (Pagel’s lambda = 0.92, P < 0.01, Blomberg’s K = 0.01, P < 0.01). The colours of the branches and the grey bars at the tips represent the wood density of each species. To identify orders that have significantly different wood densities compared to all other tree species, we conducted a two-tailed significance test by comparing the order-level wood density with 999 randomized wood density values from the entire phylogenetic tree. The coloured circle surrounding the phylogeny represents different orders. The filled blue/red circles inside the phylogeny indicate orders that show significantly (P < 0.05) lower (blue) or higher (red) wood densities relative to all the species. Numbers inside the circles represent the average wood density of the respective order.

