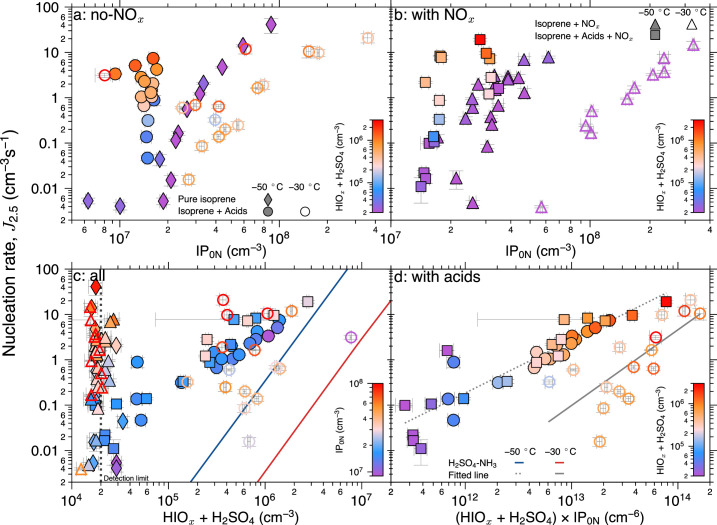
Extended Data Fig. 6. Particle-nucleation rates at 2.5 nm versus vapour concentrations.
Nucleation rates at 2.5 nm, J2.5, versus IP0N (a,b), HIOx + H2SO4 (c) and the product (HIOx + H2SO4) × IP0N (d). Panel a and b show experiments without and with added NOx. Panel c shows all experiments and panel d shows experiment with acids, both with and without NOx. IP0N excludes nitrogen-containing isoprene-oxygenated molecules. The solid lines in panel c show the nucleation rates at 1.7 nm expected for H2SO4 with 4 pptv NH3 at 60% RH (ref. 44). The dashed and solid lines in panel d represent fits to the equation 10a×log10(x)+b, in which, for the dashed line, a = 1.167 and b = −14.743, and for the solid line, a = 1.669 and b = −22.707. Panels a and b show that both total acid (HIOx + H2SO4) and IP0N contribute to the nucleation rate. The experimental conditions are: isoprene = 0.04–1.50 ppbv (0.1–4.2 × 1010 cm−3), O3 = 1–590 ppbv (3.7 × 10¹⁰ to 1.8 × 1013 cm−3), I2 = 0–7.5 × 107 cm−3, SO2 = 0–4.6 × 109 cm−3, OH = 0.11–6.90 × 107 cm−3, HO2 = 0.6–18.0 × 108 cm−3, HO2/OH ratio = 11–118, NO = 0–0.22 ppbv, NO2 = 0–0.77 ppbv, RH = 29–70% and temperature = −30 °C and −50 °C. All experiments are carried out under galactic cosmic ray ionization (ambient conditions). The error bars represent the standard deviation of the measurement at steady state.

