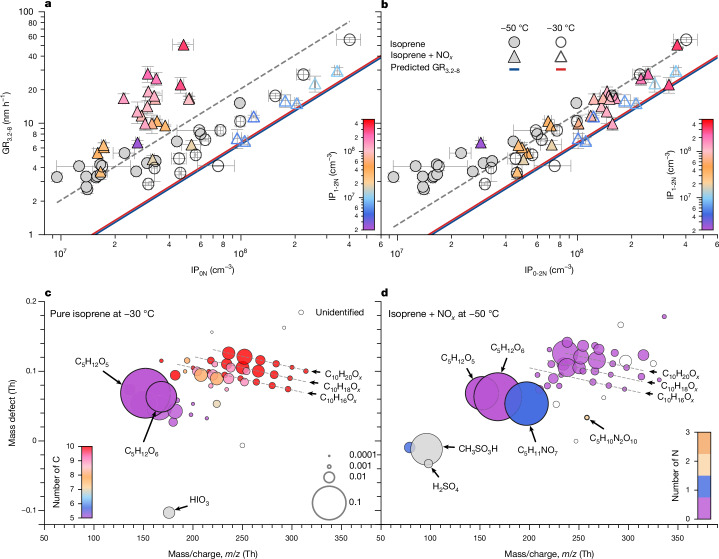
Fig. 4. Particle growth rates and particle composition.
a,b, Particle growth rates from 3.2 to 8.0 nm, GR3.2-8, versus IP0N (a) and IP0-2N (b). The solid lines show the predicted GR3.2-8 at the kinetic limit assuming monomer condensation and without considering any dipole enhancement. The prediction assumes that IP-OOM have a general formula of C5H12O6 and a density of 1.34 g cm−3 (ref. 50). The dashed lines are linear fits to the experimental data of the form GR3.2-8 = 2.04 × 10⁻⁷ × IP0N (a) and GR3.2-8 = 1.23 × 10⁻⁷ × IP0-2N (b). c,d, Mass-defect plots showing the molecular composition of particles measured with the FIGAERO at −30 °C (Br-FIGAERO) and −50 °C (I-FIGAERO), with particle geometric mean sizes ranging from 6 to 20 nm. The colour legends indicate the number of atoms of carbon (c) and nitrogen (d). The symbol area is proportional to the normalized signal by the sum of measured signals. The charger ions are removed from the molecular formula. The annotations show the molecular formula of the particle-phase compounds. Our measurements show that both IP0N and IP1-2N drive rapid early particle growth and that C5H12O5-6 are the main condensing vapours in IP0N. The experimental conditions in a and b are: isoprene = 0.05–1.50 ppbv (0.15–4.40 × 1010 cm−3), O3 = 1–592 ppbv (3.6 × 10¹⁰ to 1.8 × 1013 cm−3), I2 = 0–1.1 × 108 cm−3, SO2 = 0–4.9 × 109 cm−3, OH = 0.09–7.40 × 107 cm−3, HO2 = 0.6–19.0 × 108 cm−3, NO = 0–0.26 ppbv, NO2 = 0–0.80 ppbv, RH = 29–72% and temperature = −30 °C and −50 °C. The experimental conditions for in c are: isoprene = 1.1 ppbv, O3 = 184 ppbv, I2 = 2.9 × 107 cm−3, SO2 = 2.7 × 107 cm−3, OH = 2.3 × 106 cm−3, HO2 = 0.8 × 108 cm−3, NO = 0 ppbv, NO2 = 0 ppbv, RH = 72%, temperature = −30 °C and DMS = 0 ppbv and those for in d are: isoprene = 0.2 ppbv, O3 = 1 ppbv, I2 = 0, SO2 = 1.2 × 108 cm−3, OH = 5.2 × 107 cm−3, HO2 = 1.2 × 109 cm−3, NO = 0.11 ppbv, NO2 = 0.65 ppbv, RH = 38%, temperature = −48 °C and DMS = 0.16 ppbv. The vertical error bars represent the statistical uncertainty in the appearance-time growth-rate measurements derived from the 95% confidence interval on the growth-rate fit. The horizontal error bars represent the standard deviation of measured IP0N or IP0-2N during the growth period.

