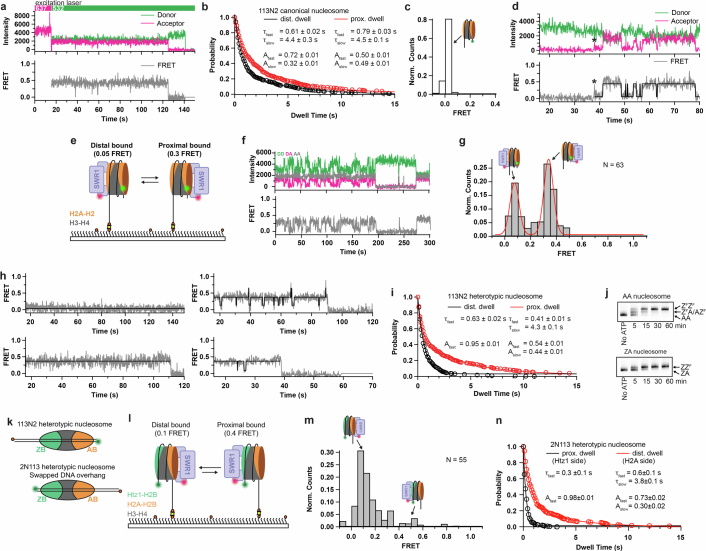
Extended Data Fig. 4. Additional data and controls relating to the experiments in Figs. 3 and 4 of the main text.
a, Example fluorescence intensity trajectory (top) and corresponding FRET trajectory (bottom) resulting from SWR1(647N) bound to a surface immobilized nucleosome. The excitation scheme used is illustrated with the magenta and green bars (top). After locating SWR1(647N) bound nucleosomes with red excitation, FRET between the nucleosome and SWR1(647N) is monitored using green excitation. Single step photobleaching of the acceptor and donor indicate a single FRET pair. b, Dwell time plot of the dwell times in the proximal or distal bound configurations for a nucleosome containing two H2A–H2B dimers (data from Fig. 3d, replotted here to show additional details of the fit). Dwell time is fit to a double exponential decay. The lifetimes in the fast (τfast) and slow (τslow) phases are indicated, along with the corresponding amplitudes (Afast, Aslow). The lifetimes are approximately equal regardless of SWR1 orientation. c, FRET histogram of nucleosome (donor) only control displaying zero FRET in the absence of any SWR1(647N) (acceptor). d, Example fluorescence intensity trajectory (top) and corresponding FRET trajectory (bottom) showing SWR1(647N) binding to a surface immobilized nucleosome (indicated by *), and subsequently flipping between dye-distal and dye-proximal orientations. SWR1(647N) binding results in a small but detectable non-zero FRET. (Note: such a trajectory would not be included in subsequent analysis as it does not satisfy the criterion of having SWR1(647N) bound at the start of data acquisition, but is shown here to illustrate detection of SWR1(647N) binding and flipping.) e, Schematic of the assay where the donor fluorophore is placed on one of the H2A histones: Nucleosomes (113N2) labelled with Cy3B on the linker-distal H2A are surface immobilized. SWR1(647N) is flowed in and allowed to bind the nucleosomes. SWR1(647N)–nucleosome interactions are monitored via FRET. Repositioning the FRET donor from the short DNA overhang (as used throughout the rest of this work) to the linker-distal H2A results in lower FRET efficiencies. To identify these true low-FRET values we employed alternating laser excitation throughout the entire acquisition. f, Trajectory of a dynamic SWR1(647N) bound nucleosome showing donor emission upon donor excitation (DD, green trace, top); acceptor emission upon donor excitation (DA, magenta trace, top); acceptor emission upon acceptor excitation (AA, gray trace, top). DD and DA are used for calculating apparent FRET efficiency (gray trace, bottom). g, Idealized FRET histogram shows two major populations of SWR1(647N)–bound nucleosomes. We observe similar ratios of the two states regardless of FRET donor position (c.f. Fig. 3). h, Additional smFRET traces from the experiment described in Fig. 4b. i, Dwell time plot of the dwell times in the proximal or distal bound configurations for a heterotypic nucleosome containing one Htz1–H2B and one H2A–H2B dimer (data from Fig. 4d, replotted here to show additional details of the fit). While the time spent on the distal side (i.e., the side containing Htz1) is well described by a single exponential decay, the proximal (H2A containing side) is best fit to a double exponential decay. Compare with (b). The lifetimes in the fast (τfast) and slow (τslow) phases are indicated, along with the corresponding amplitudes (Afast, Aslow). j, Bulk assay showing the exchange of a canonical H2A–H2B nucleosome (AA) compared to a heterotypic nucleosome containing one Htz1–H2B and one H2A–H2B dimer (ZA). The insertion of a FLAG tagged Htz1–H2B dimer is used as a readout for exchange. The AA nucleosome undergoes two consecutive rounds of exchange (indicated by the appearance of a double band shift). However, the ZA nucleosome can only be exchanged once (single band shift) indicating that SWR1 does not remove Htz1–H2B dimers from a nucleosome. Representative gel of two independent experiments using enzyme from separate purifications. For gel source data, see Supplementary Fig. 1. k, Cartoons of 113N2 heterotypic nucleosome (top) and 2N113 swapped DNA overhang heterotypic nucleosome (bottom). The position of the Cy3 fluorophore (green circle) and biotin (orange circle) are shown. Swapping the DNA overhang orientation with respect to the 601 positioning sequence results in the Htz1–H2B variant histone either being adjacent or opposite to the long DNA overhang. l, Swapped DNA overhang heterotypic nucleosomes (Cy3.2N113) containing one Htz1–H2B dimer (green) and one canonical H2A–H2B dimer (orange) Cy3-labeled on the 2 bp overhang are surface immobilized. SWR1647N is flowed in and allowed to bind to the nucleosome. SWR1(647N)–nucleosome interactions are monitored via FRET. m, Idealized FRET histogram shows a main population at low (0.1) FRET (c.f. Fig. 4c). n, Dwell time plots for the distal to proximal (red) and proximal to distal (black) transition for a 2N113 heterotypic nucleosome. Binding to the H2A–H2B face of the nucleosome is more stable than binding to the Htz1–H2B face, irrespective of the location of the long DNA overhang.

