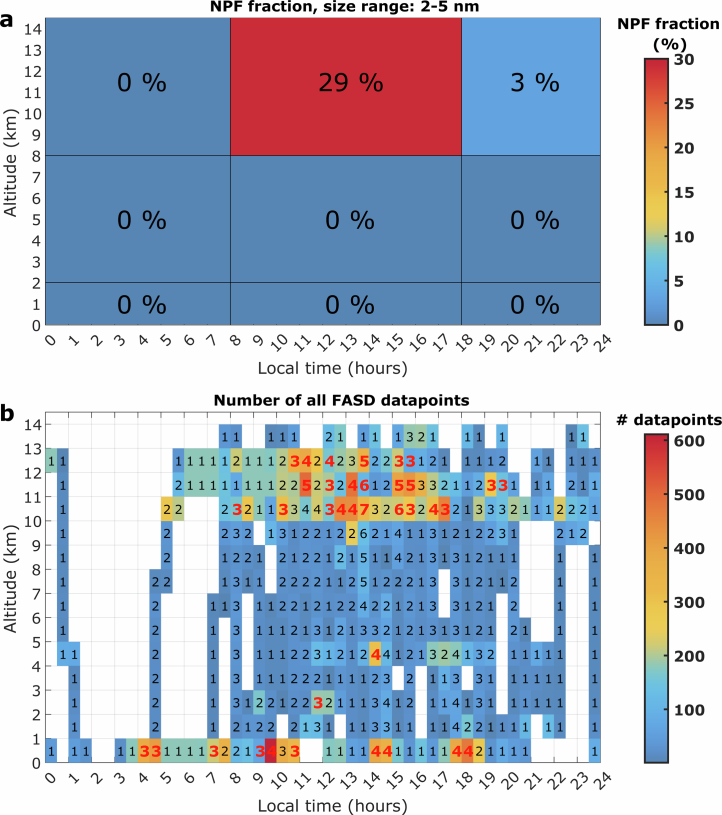
Extended Data Fig. 7. Frequency of NPF events detected during RF 09 to RF 20.
a, Data from Fig. 4 are binned vertically into boundary layer (0–2 km), lower and middle free troposphere (2–8 km) and the upper troposphere (>8 km). Time bins with respect to day-time when NPF is observed (08:00–18:00 LT) as well as night-time and early morning (before 08:00 LT and after 18:00 LT). b, The number of measurements per pixel for the data shown in Fig. 4. The number in each pixel denotes the number of contributing aircraft flights. Numbers in red denote pixels with at least three flights and 20 data points per flight. The colours denote the total number of data points obtained, with each data point representing a 1-min average value during a flight. Data from RF 16 are excluded; N2–5 is replaced by N3–5 for RF 17.

